SOSCHI Framework Overview
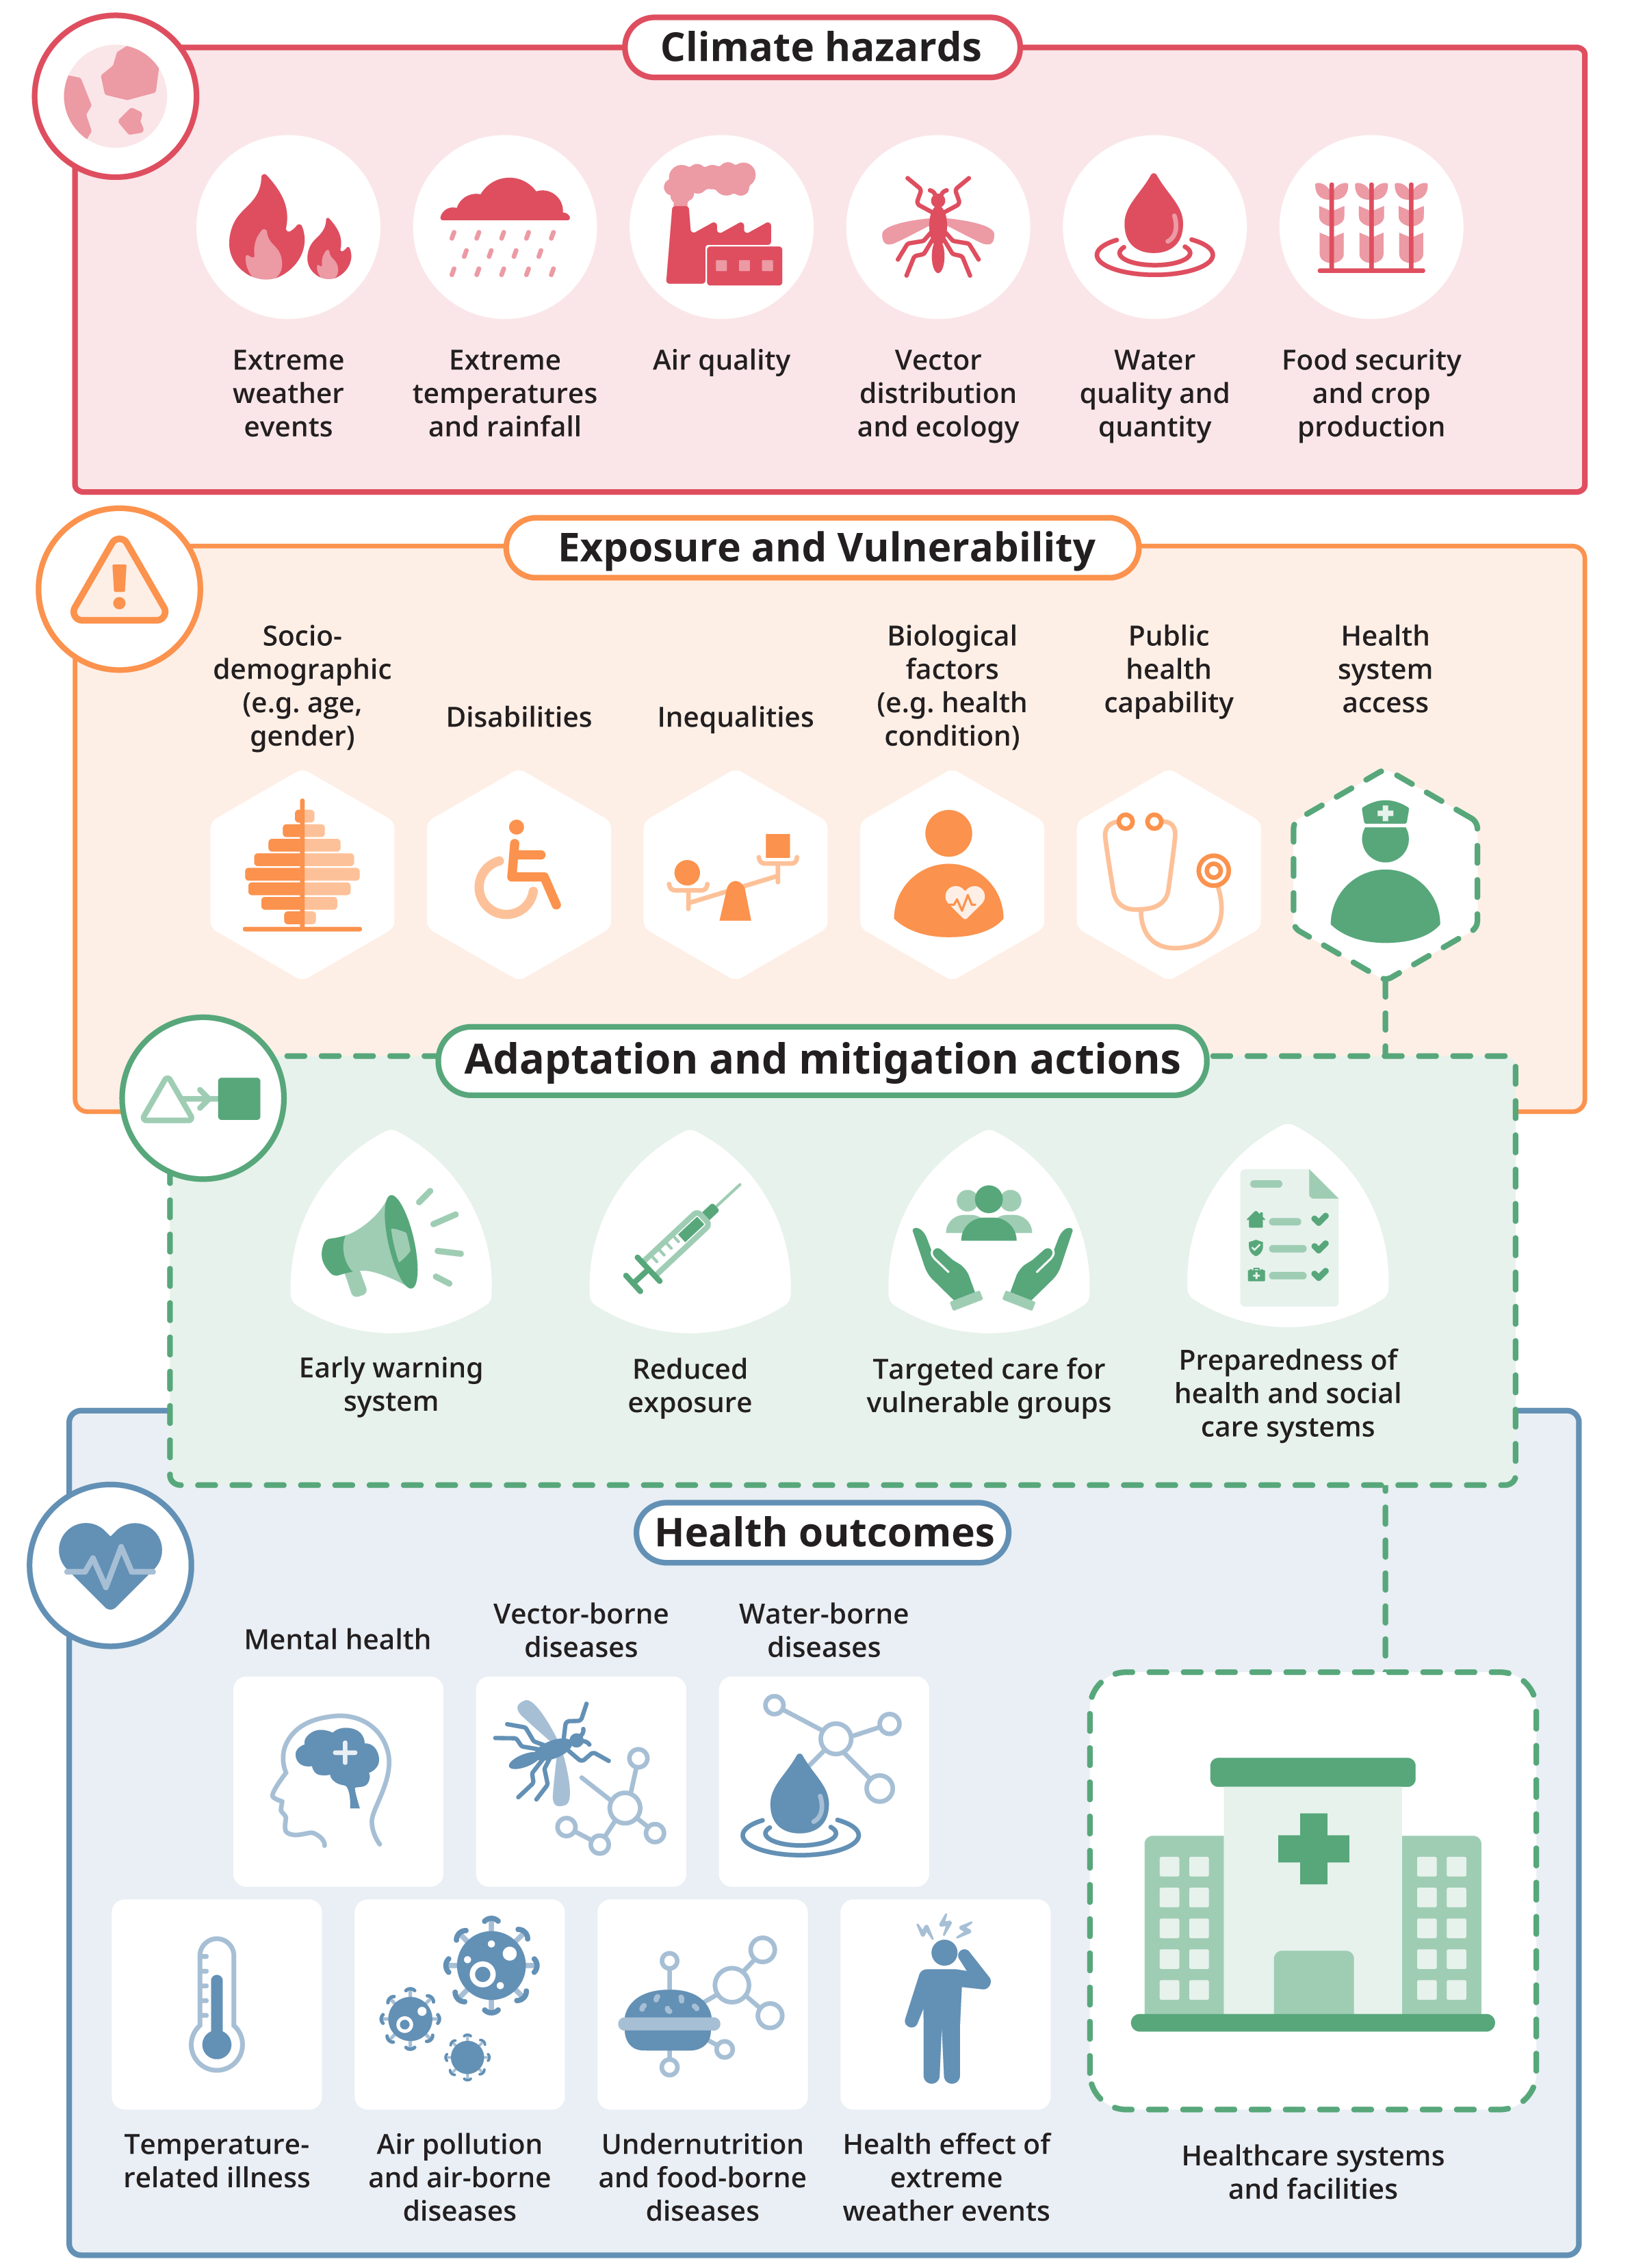
The SOSCHI framework covers a wide range of health-related topics which are affected by climate change, namely waterborne diseases, vector-borne diseases, temperature-related health effects, mental health, health effects of extreme weather events (wildfire and floods), health effects of air pollution and air-borne diseases, undernutrition and food-borne diseases, and healthcare systems and facilities. The final SOSCHI Framework report and final topic documents for selected topic documents are available, for all other topics alpha versions are available (see section on "Guidance and tools to support user implementation").
The SOSCHI framework has been developed by ONS in collaboration with partners from the African Institute for Mathematical Studies (AIMS) in Rwanda, and the Regional Institute for Population Studies (RIPS) in Ghana and with input from the UK Health Security Agency, the Cochrane Planetary Health Theme Group, and a large number of leading subject experts.
See the About us page for more information.
Figure 1 illustrates the timeline and stages of the SOSCHI project. The activities that defined the earlier stages of the project are described in detail in the previously published Discovery Phase Report and Alpha phase report.
Discovery Phase (2022 - 2023)
ONS Climate and Health team begin
Alpha Phase (2023 - 2024)
First draft of statistical framework and platform
Beta Phase (2024 - 2025)
Further refinement of framework and platform
Launch (2026)
Final drafts signed off
The involvement of experts and users throughout the development process has ensured that proposed indicators are based on state-of-the-art statistical methods and can be implemented beyond the project partner countries.
The “topic pages” also include information on the specific experts engaged in the development of the SOSCHI framework.
If you want to produce any of the priority indicator metrics included in the SOSCHI framework, you will first need to identify and prepare the input data sources. Once the input data is in the required structure, you can either use the Climate-Health R Package or the indicator tool for selected topics, to produce selected climate-health indicator metrics for your country or area.
Additional guidance is available to support users (e.g. topic documents, guidance videos etc). The available guidance and tools available for each topic in the SOSCHI framework are summarised in the table below.
The guidance tools include:
- Topic introduction: state of knowledge on the topic and rationale of topic and indicator selection
- Methods documents: outline of statistical approaches to measure the headline indicator
- Metadata sheets: summary of the headline indicator metrics and their component parts to support user implementation
- R code: Published Climate-Health R Package (available via the SOSCHI GitHub repository or CRAN in RStudio), for users to run in their offline workflow and adapt the methods for measuring climate-health indicator metrics for their local context using their own data
- Online tool: Ready to use analysis tool for measuring climate-health indicator metrics are in development, and will be available on this platform, based on the generic model using their own data upload, no prior knowledge of R coding required
The SOSCHI framework topics are at a different stage of readiness. The first six selected topics in the table below have been prioritised, with more comprehensive guidance to support users in implementing these to produce indicator metrics based on the input data sources from their country.
Key
- Included
- In progress
- Not included
| Framework topics | Alpha Version | Final Version | R Package | Indicator Tool |
|---|---|---|---|---|
| Waterborne diseases (diarrhea) |
|
|
|
|
| Waterborne diseases (chemical contaminants) |
|
|
|
|
| Vector-borne diseases (malaria) |
|
|
|
|
| Temperature-related health effects |
|
|
|
|
| Mental health (suicide) |
|
|
|
|
| Health effects of air pollution |
|
|
|
|
| Airborne diseases (cerebrospinal meningitis) |
|
|
|
|
| Health effects of extreme weather events (wildfires) |
|
|
|
|
| Health effects of extreme weather events (flooding) |
|
|
|
|
| Undernutrition and food-borne diseases |
|
|
|
|
| Healthcare systems and facilities |
|
|
|
|
The aim of the SOSCHI Framework is to support National Statistics Offices (NSOs) in systematic monitoring of climate change outcomes and help to build relevant expert capacity globally, especially in low- and middle-income countries' (LMIC) statistical institutions.
The work has been developed collaboratively between partners in Ghana, Rwanda and the UK so that experience and priorities in Africa, where some of the worst climate change impacts are already evident, are central to the development. For each of these partner countries, implementation plans are in progress, to share experiences and lessons learned to inform global implementation.
The main benefit of the SOSCHI framework, and its contribution to this field, is providing National Statistics Organisations (NSOs) and other government institutions with harmonised indicators, validated methods and practical tools, to improve the monitoring of climate change impacts on health.
The following six headline indicators from the SOSCHI framework were endorsed by the 57th session of the United Nations Statistical Commission (3-6 March 2026) as part of the authoritative UN Global Set of Climate Change Statistics and Indicators.
- 44.1 Incidence of diarrheal disease cases attributable to (a) heat and (b) rainfall
- 44.2 Incidence of malaria cases attributable to (a) heat and (b) rainfall
- 45.1 Mortality from all causes attributable to (a) heat and (b) cold
- 45.2 Mortality from suicide attributable to excess heat (proxy for mental health)
- 46.1 Mortality attributable to short-term effects of Ambient air quality (PM2.5)
- 46.2 Mortality attributable to effects of wildfire smoke (PM2.5)
The proposal was developed with the support of the UN Expert Group on Environment and Climate Change Statistics (EG-ECCS) and its Sub-Group on Climate and Health, and updates the metadata of Global Set indicators 44, 45 and 46 in line with the definitions and methodologies developed by the project.
See the about us page for more information on those countries and institutions involved in the EG-ECCS climate-health sub-group, and the "events page" for information on our global engagement. For more information on our global stakeholder engagement, see the SOSCHI framework report (section 2.3: Relationship to other frameworks).
Explore our priority topics
Temperature-related health effects
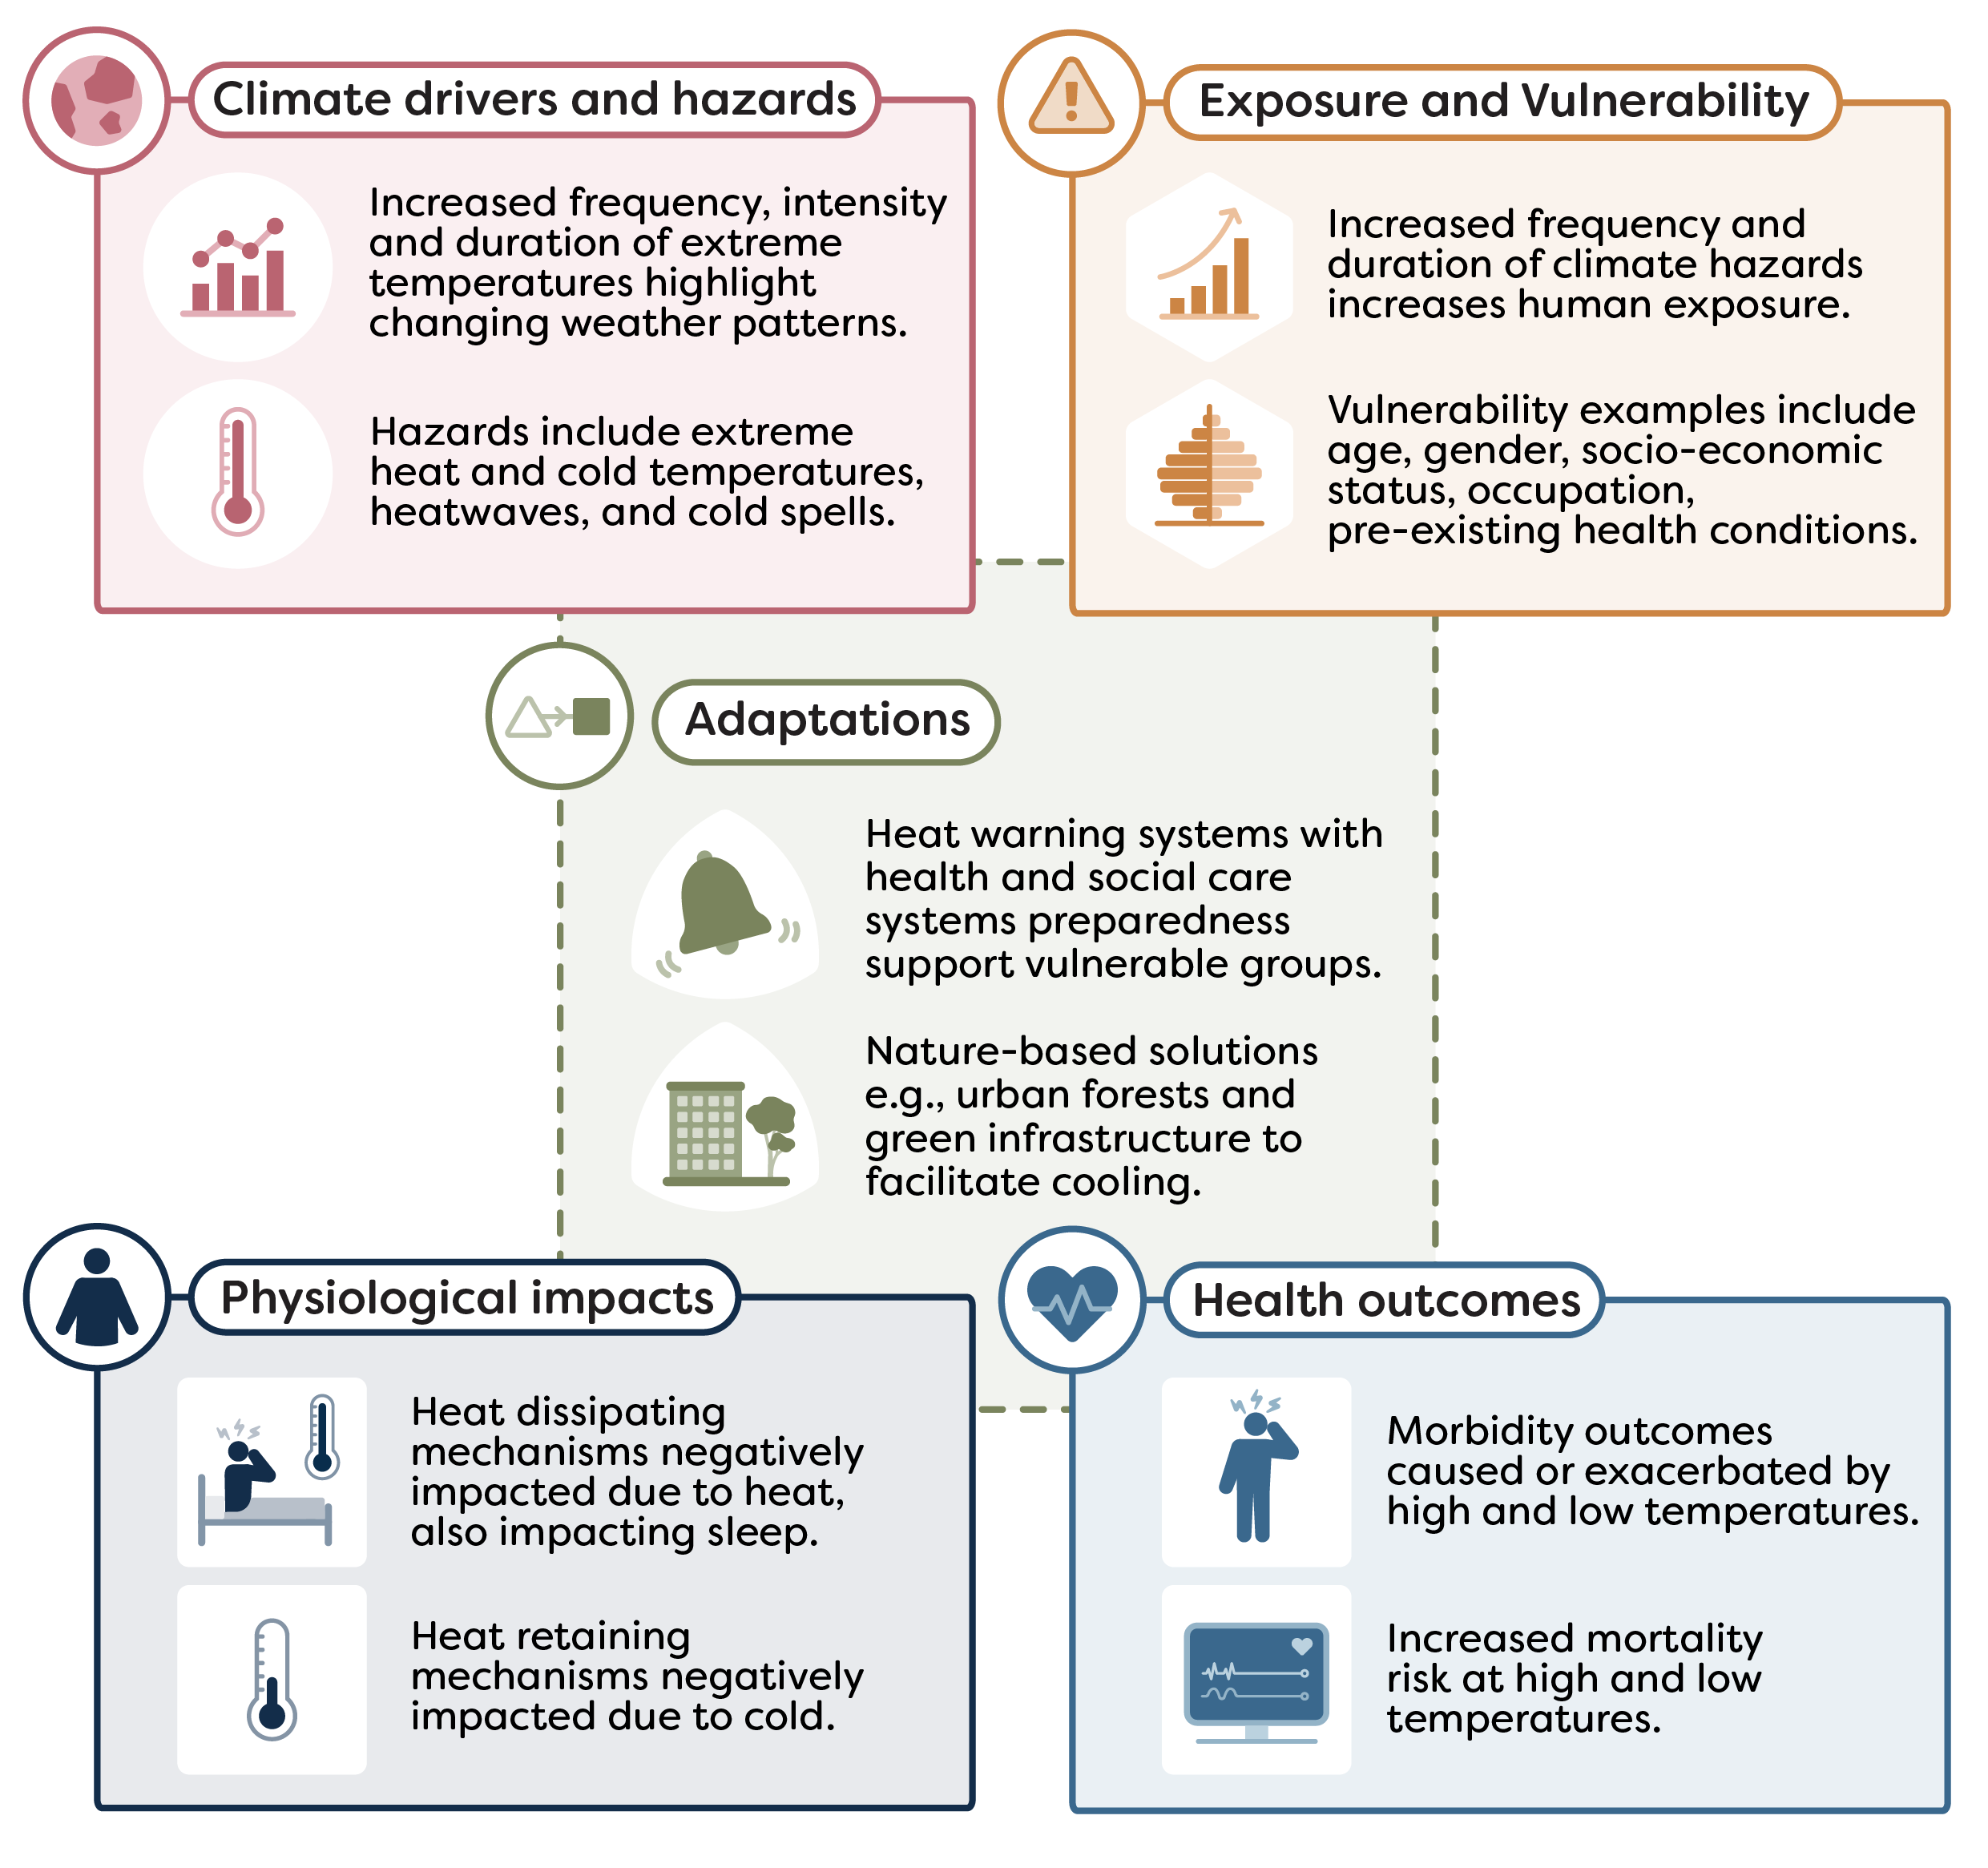
Climate change is altering global temperature trends. Increasing the frequency, intensity, and duration of temperature extremes in many countries. Rising global temperatures, and the impact on health are of global concern. Current research suggests that globally there are more cold-related deaths than heat-related. However, the global rate of increased climate-related mortality from heat is predicted to offset the rate of decrease in mortality from cold during the 21st Century.
This topic explores the relationship between temperature as a climate hazard and the impacts on human health.
UN endorsement
The methods for measuring the headline outcome indicator for this topic were endorsed by the 57th United Nations Statistical Commission to include in the Global Set of Climate Change Statistics and Indicators (see decision 57/109 (b) in the Final Report ). This will be included in the Global Set metadata as:
- Indicator 45: Incidence of heat and cold related illnesses or excess mortality:
45.1 Mortality from all causes attributable to (a) heat and (b) cold
The priority indicator developed for this topic is all-cause mortality attributable to high and low temperatures.
There are two main aims of this indicator:
- to allow users to estimate the relationship between temperature and mortality using historical data records
- to allow users to produce modelled estimates of the impact of high and low temperatures on mortality
Further justification for the focus on this indicator is explained in the Topic introduction , which also outlines supplementary and additional indicators that are not in scope for the current SOSCHI framework but are recommended for future development.
The indicator has four component parts:
Relative risk for the temperature-mortality association
Attributable number as the number of deaths attributable to high and low temperatures
Attributable fraction as the percentage of deaths attributable to high and low temperatures
Attributable rate as the number of deaths per 100,000 population attributable to high and low temperatures
For guidance on the process for calculating these indicator metrics, see the Methodology section below.
This methodology also covers the following sub-indicator which specifies the underlying cause of death: Non-communicable disease (NCD) mortality attributable to high and low temperatures and produces the same outputs as the headline indicator noted above.
The interaction between climate change and health is especially evident in the growing burden of NCDs, which are further exacerbated by environmental shifts.
Table 1 of the methodology document specifies codes for underlying cause of death related to NCDs as captured in the SOSCHI NCD Topic Introduction document. These codes refer to the WHO International Classification of Diseases, 10th edition (ICD-10) or 11th edition (ICD-11) . These codes represent the underlying cause of death, which in many countries is the only health condition reported from death registration.
NCDs was previously a separate topic in the SOSCHI framework.
Topic Introduction (opens in a new window)This indicator can give insights into how high and low temperature days may be impacting physical health and how this may vary geographically and impact vulnerable groups in society.
This indicator can therefore:
- inform national adaptation plans (NAPs) and targeted resilience strategies
- guide climate and public health policy to help mitigate risks and improve health outcomes
The indicator quantifies the short-term impacts of high and low temperatures on mortality using a quasi-Poisson time series regression with a distributed lag non-linear model (DLNM). This model accounts for both the delayed health effects seen after the occurrence of a high or low temperature day, and the non-linear relationship between temperature and mortality i.e. mortality risk increases as temperatures become more extreme.
The model estimates the temperature–mortality relationship, relative to the lowest risk temperature i.e. the minimum mortality temperature. When multiple geographies are analysed, the results are combined using a multivariate meta-analysis to strengthen estimates and produce results for the combined geographical area e.g. national level.
Understand the method
Read the Mortality attributable to high and low temperatures: methodology for details on the modelling approach, the data needed, and guidance on interpreting results.
Develop bespoke analysis
For flexible, reproducible analysis or to adapt methods to your country or region, use the R package , which provides program code for the priority indicators.
Online tools for indicator analysis
Tools for selected indicators are in development. These will allow users to run quick baseline estimates and simple charts without writing code; it supports secure temporary uploads and downloadable outputs.
This indicator requires:
- daily mortality data from national administrative records
- population estimates from national statistical agencies
- daily mean temperature and other optional climatic variables from government meteorological offices
Where data points are missing, proxy datasets may be used as recommended in section 2.2 of Mortality attributable to high and low temperatures: methodology . Guidance on required variables and how to prepare the dataset can also be found in section 2.3 and 3.2.
FAQs
Climate change is leading to more frequent and extreme hazards that have direct and indirect effects on populations. For example, increasingly high and low temperatures have been found to show an impact on mortality risk.
The estimated change of mortality risk due to high or low outdoor temperatures, compared to the lowest risk temperature for the area. It also estimates the number, rate and proportion of deaths attributable to high or low temperatures, i.e. the number, rate or proportion of deaths that have occurred due to high or low temperatures.
The results can help identify which groups are most vulnerable at certain high or low temperatures. This can help plan interventions to build resilience to mitigate the risks associated with the changing temperature patterns.
See the methodology document for details on the indicator metrics.
This indicator can be used by analysts who meet the following criteria:
- have access to daily mortality data and daily temperature data
- have access to population estimates for the applicable geography/geographies or other disaggregated groups
- have some understanding of how to interpret the indicator metrics, and can communicate uncertainty using statistical power, using guidance provided in section 4 of the methodology document
Users can apply the methodology to their own daily temperature and mortality data to run a time series model with our open-source R package available on GitHub or CRAN.
Please see the Analysis pathways guidance page for more detail.
Daily data provide the highest level of accuracy for this indicator. However, previously published literature (see methodology document section 1 for more info and references) has demonstrated that the method produces reasonable estimates with weekly data in the context of Europe.
See section 2.2 of the methodology document for alternative data sources that can be used as proxy data.
The method is not applicable to monthly data.
The methodology can be applied to any geographical level e.g. national, local, but the power of the data must be considered. The R package includes a function to produce this. Users should aim for 80% power and document whether this has been achieved when communicating results (See section 3.7 and 4 of Mortality attributable to high and low temperatures: methodology ).
Yes, the data will need to be subset prior to running the analysis e.g. including death count columns for each age group. Users should consider whether their data has enough power to help achieve more accurate results. The R package includes a function to produce this. Users should aim for 80% power and document whether this has been achieved when communicating results (See section 3.7 and 4 of Mortality attributable to high and low temperatures: methodology ).
These were set based on existing literature (see methodology document section 3.1 for more info and references) and consultation with a group of climate and health international experts. These are based on the temperature distribution over the whole time series provided for each geographical area. These are the default settings, and we encourage users to apply these for consistent official reporting. However, users can adjust these if other percentiles are more relevant for their context.
Anthropogenic climate changes have affected weather and climate extremes in every region of the globe. These are predicted to have impacts on both warming and cooling under future climate change scenarios. Published estimates report approximately 489,075 heat-related deaths globally, between 2000-2019. However, a higher number of deaths have been estimated related to exposure to cold temperatures, with estimations reaching approximately 4,594,098 cold-related deaths globally, during the same period. However, the global rate of increased climate-related mortality from heat is predicted to offset the rate of decrease in mortality from cold during the 21st Century. This will lead to net mortality from high and low temperatures increasing.
See section 4: communication and interpretation of the methodology document for guidance on interpreting the indicator metrics outlined above.
Also see sections 2.5 and 5 of the methodology document respectively to understand the data and methodology limitations of the indicator.
No, these are estimates based on a statistical model and not observational. These are produced by modelling the association between daily mortality counts and daily mean temperature. This association is then used to estimate the attribution to high and low temperatures. As these are modelled estimates there are uncertainty around the statistics that should be considered in any interpretation of results.
For broader questions that apply across the platform, please see our General FAQs section.
Related Topics
Topic Expert Group
The Topic Expert Groups (TEG) were set up to review climate and health topics and guide what we measure and how we measure it. The groups bring together internal and external specialists who advise on indicators and methods, share subject knowledge, and help quality assure draft outputs before publication.
The framework topic documents are a final version produced as part of the SOSCHI project (Wellcome grant no. 224682/Z/21/Z). Please note that as this is an emerging topic area, indicators and methods are subject to change. Notices will be issued on this page to inform users of any changes to the information captured.
For more information on the selection criteria used for prioritising the SOSCHI topics and the development process, see the SOSCHI Framework Page .
We recommend that the proposed indicators, methods and tools (e.g. R code) described on this page can be used for official statistics reporting. See the SOSCHI Framework Page for information on the endorsement of the proposed indicators.
Last updated: 14/05/2026
Health effects of extreme weather events
Contents
Health effects of wildfire-related PM2.5
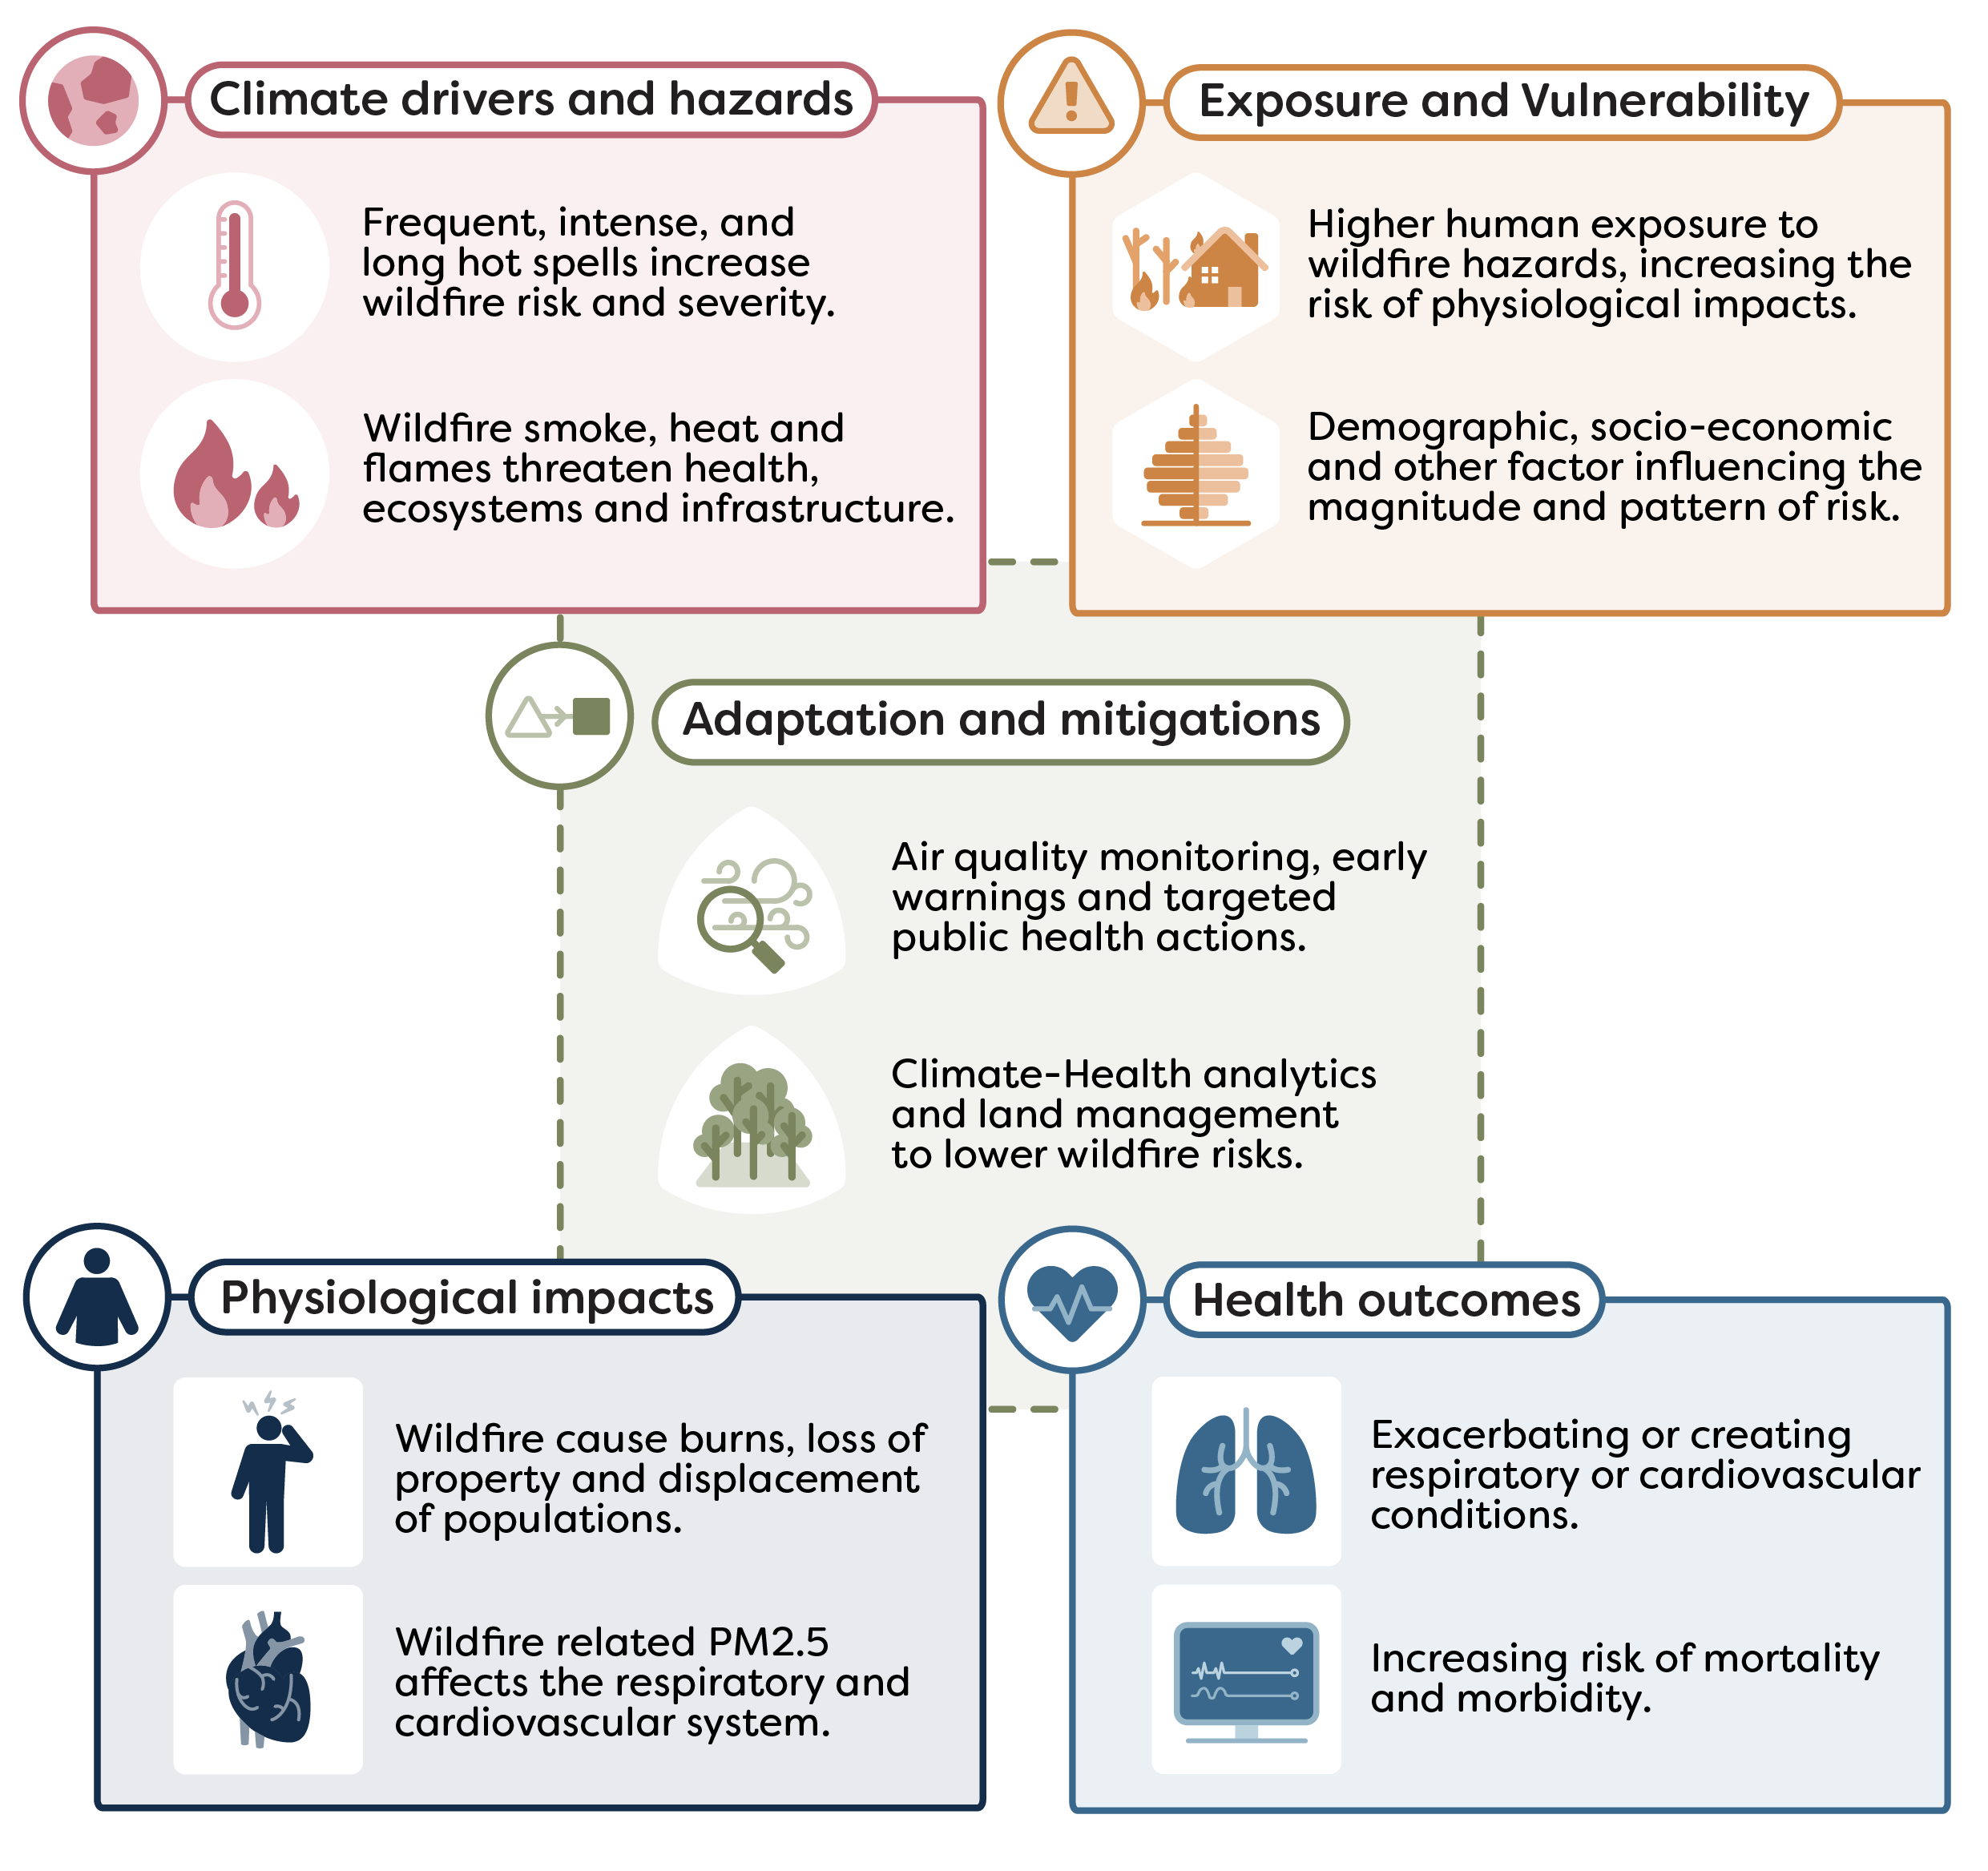
Climate change is increasing the frequency, intensity, and duration of hot and dry conditions, raising the risk of wildfires in many regions. Wildfires are uncontrolled or unplanned fires that occur in vegetated areas. Their impacts extend beyond the burned areas, affecting ecosystems, economies and human health. A major health hazard from wildfires is its associated smoke and air pollution. Vulnerability to this exposure is controlled by demographic and socioeconomic factors, thus risk is not distributed evenly within populations.
This topic area focuses on measuring population-level exposure to wildfire-related PM2.5 and estimating its short-term impacts on health.
UN endorsement
The methods for measuring the headline outcome indicator for this topic were endorsed by the 57th United Nations Statistical Commission to include in the Global Set of Climate Change Statistics and Indicators (see decision 57/109 (b) in the Final Report ). This will be included in the Global Set metadata as:
- Indicator 46: Climate-induced air pollution:
46.2 Mortality attributable to effects of wildfire smoke (PM2.5)
The priority indicator developed within this topic is All-cause mortality attributable to wildfire-related PM2.5.
It was agreed to prioritise this indicator as wildfire-related PM2.5 is strongly linked to adverse health outcomes and has a well-established evidence base in epidemiological studies. Wildfire-related PM2.5 is also consistently measured across regions, enabling comparable and policy relevant assessments of wildfire-related health impacts.
Further justification for focusing on this indicator is provided in the Topic introduction . This methodology also covers two additional indicators, with further details available in the methods documentation:
- respiratory mortality attributable to wildfire-related PM2.5
- cardiovascular mortality attributable to wildfire-related PM2.5
Each indicator has three component parts:
Relative risk of mortality associated with wildfire-related PM2.5
Number of deaths attributable to wildfire-smoke PM2.5
Deaths per 100,000 population attributable to wildfire-related PM2.5
For guidance on the process for calculating these indicator metrics, see the Methodology section below.
This indicator can provide insights into how wildfire PM2.5 exposure is impacting human mortality, and how these risks vary across locations and vulnerable groups. While wildfire-related mortality does not capture the full spectrum of health impacts (e.g., morbidity or long-term exposure effects), it serves as a robust proxy for the most severe acute outcomes associated with wildfire events.
This indicator can therefore:
- monitor and quantify the health impacts of wildfires, particularly mortality risk
- identify geographic and population-level disparities, including the most vulnerable groups
- identify seasonal patterns and monitor wildfire mortality risk over time
- inform national adaptation plans (NAPs) and climate resilience strategies
- guide public health, environmental, and emergency response policies to reduce risks and improve outcomes
This indicator estimates mortality attributable of wildfire-related PM2.5 by comparing exposure on days when deaths occur with similar nearby days. It accounts for seasonal patterns and long-term trends and examines delayed effects over several days. Results are reported as the relative increase in mortality risk for every 10 µg/m³ rise in wildfire-related PM2.5.
Understand the method
Read the all-cause mortality attributable to wildfire smoke: methodology for details on the modelling approach, the data needed, and guidance on interpreting results.
Develop bespoke analyses
For flexible, reproducible analysis or to adapt methods to your country or region, use the R package , which provides program code for the priority indicators.
Online tools for indicator analysis
Tools for selected indicators are in development. These will allow users to run quick baseline estimates and simple charts without writing code; it supports secure temporary uploads and downloadable outputs.
The following data are needed for this indicator production:
- daily all-cause mortality from national administrative records.
- daily mean temperature from governmental meteorological offices.
- population estimates from national offices
- daily Wildfire-related PM2.5 from open source dataset.
Where this data is unavailable or observations are incomplete, proxy datasets may be used. Further information on these potential sources as well as required variable names and formats are outlined in section 2 of the All-cause mortality attributable to wildfire smoke: methodology . A minimal example of the data template is provided on the Indicator tool page to help structure uploads before running the calculator.
FAQs
The statistical approach used is time stratified case crossover design with conditional quasi-Poisson regression model. This is appropriate for analysing acute health impacts of short-term wildfire related PM2.5 exposure. It allows to compare health outcome on high wildfire PM2.5 exposure days with nearby non wildfire PM2.5 exposure days. This approach controls for season, long-term trends, and day of the week.
The methodology was developed with guidance and consultation from Topic Expert Group and further information can be found in methodology documentation .
The indicator shows the short-term effects of wildfire related PM2.5 on daily mortality. It quantifies relative risk of death associated with wildfire smoke exposure. It also estimates proportion of deaths attributable to exposure and mortality rates per 100,000, standardised so results are easily comparable across regions. Detailed information can be found in the methodology documentation.
The indicator is intended for users who need to assess the impact of wildfire-related PM2.5 exposure on human mortality. Our target users are global producers of official statistics, academics, students, NGOs and also policymakers who can use the statistics to support and evidence action against climate hazards.
Wildfire related PM2.5 is one of the main harmful components of wildfire smoke. PM2.5 refers to very fine particles that when inhaled, can go deep into the lungs and enter the bloodstream, where they can cause wide range of health issues. Studies show that wildfire related- PM2.5 has distinct toxicological characteristics compared to PM2.5 from other ambient air pollution sources and may be more harmful to human health. It is also one of the most well studied wildfire components, with strong evidence linking to health risks. Because wildfire‑related PM2.5 captures both nearby and transported smoke and has a well‑established scientific basis for measuring exposure, it was selected as the primary indicator. For further reading, please refer to methods document.
When using this methodology, we recommend users to use this dataset provided by Finnish Meteorological Institute. It uses satellite data (MODIS instrument onboard of Aqua and Terra satellite) combined with atmospheric modelling (SILAM chemical transport model) to estimate the dispersion of fire related PM (particulate matter). The dataset has global coverage, for further information – please refer to the Wildfires methodology documentation .
To run the wildfire analysis, users require daily all-cause mortality data. List of supplementary indicators and related data requirements can be found in the methods document. In all cases, we recommend users to follow data preparation procedures as listed in methods document (section 3.2) prior to analysis.
This version of wildfire methodology uses wildfire-related PM2.5 (fine smoke particles) data developed by the Finnish Meteorological Institute and is updated annually. Please refer to methodology documentation for further details.
Weekly or monthly aggregated death count data are not compatible with this methodology as this approach looks at the short-term health impact and is designed to compare specific exposure days to low exposure days. Also, weekly or monthly aggregations smooths over wildfire smoke days which are typically intense, short-lived and highly variable within a few days.
There is no single fixed minimum, but in practice you would need a few months of daily data to run the wildfire analysis. For more reliable results, it is advised to use several months to multiple years of data, ideally covering a full wildfire season. Please note that there would be model bias if data consists of only wildfire events and vice versa. For further methodology analysis, please refer to documentation.
Users should carefully follow the recommended data preparation procedures to ensure valid results. We strongly recommend using the GitHub analysis package, which includes built-in model validation steps to help ensure robust estimates are produced. All results should be interpreted as statistical estimates, not actual counts of death, and should always be considered together with their confidence intervals.
The analysis is based on historic data and does not provide real-time estimates. Wildfires vary substantially between regions, and new or emerging wildfire-affected areas may not yet be fully captured in the data. For further information, please refer to methods document.
Yes, provided data is set up and ready to use as recommended by the methodology document (section 2.3, 3.2 and 3.3), this indicator analysis will provide comparable results.
A value of zero indicates no detectable association between wildfire-related PM2.5 and mortality for the time period. A negative estimate does not imply wildfire smoke is protective but should be interpreted as no evidence of an increased risk. Negative values can arise from limited sample size and/or statistical uncertainty. Estimate results should be considered together with its confidence interval.
All results from the analysis show statistical associations between wildfire‑related PM2.5 and mortality. They estimate how many deaths are linked to this exposure, not a direct count of observed deaths. For detailed guidance on how to interpret and communicate the indicator results, please refer to methodology documentation (section 4).
The analysis results can quantify how real health impacts from wildfire-related PM2.5 has changed over time and can provide the evidence for action. With recommended disaggregation, the data can be used to inform for targeted prevention and preparedness.
For broader questions that apply across the platform, please see our General FAQs section.
Related Topics
Topic Expert Group
The wildfires topic expert group (TEG) was setup to review this topic and guide what we measure and how we measure it. The group brings together internal and external specialists who advise on indicators and methods, share subject knowledge so we build on existing work and good practice, and help quality assure draft outputs before publication.
The framework topic documents are a final version produced as part of the SOSCHI project (Wellcome grant no. 224682/Z/21/Z). Please note that as this is an emerging topic area, indicators and methods are subject to change. Notices will be issued on this page to inform users of any changes to the information captured.
For more information on the selection criteria used for prioritising the SOSCHI topics and the development process, see the SOSCHI Framework Page .
We recommend that the proposed indicators, methods and tools (e.g. R code) described on this page can be used for official statistics reporting. See the SOSCHI Framework Page for information on the endorsement of the proposed indicators.
Last updated: 04/06/2026
Health effects of flooding
Flooding is a significant global health hazard, with far-reaching implications for public health, infrastructure, and socioeconomic stability. Climate change has significantly increased the frequency and severity of flooding events through more intense precipitation, elevated sea levels and accelerated snowmelt.
This topic area focuses on quantifying the short-term health impacts associated with flash and fluvial floods.
The framework topic documents are an alpha version produced as part of the SOSCHI project (Wellcome grant no. 224682/Z/21/Z). Please note that as this is an emerging topic area, indicators and methods are subject to change. Notices will be issued on this page to inform users of any changes to the information captured. For more information on the selection criteria used for prioritising the SOSCHI topics, see the SOSCHI Framework Page for more information on the development process.
The proposed indicators and methods described on this page are not fully ready for implementation within official statistics reporting. The current version has been shared in line with our open-source values – to encourage collaboration, transparency and accessibility allowing users to freely, use, modify and update these guidance materials and tools developed as part of the SOSCHI project.
Air pollution and air-borne diseases
Contents
Health effects of air pollution
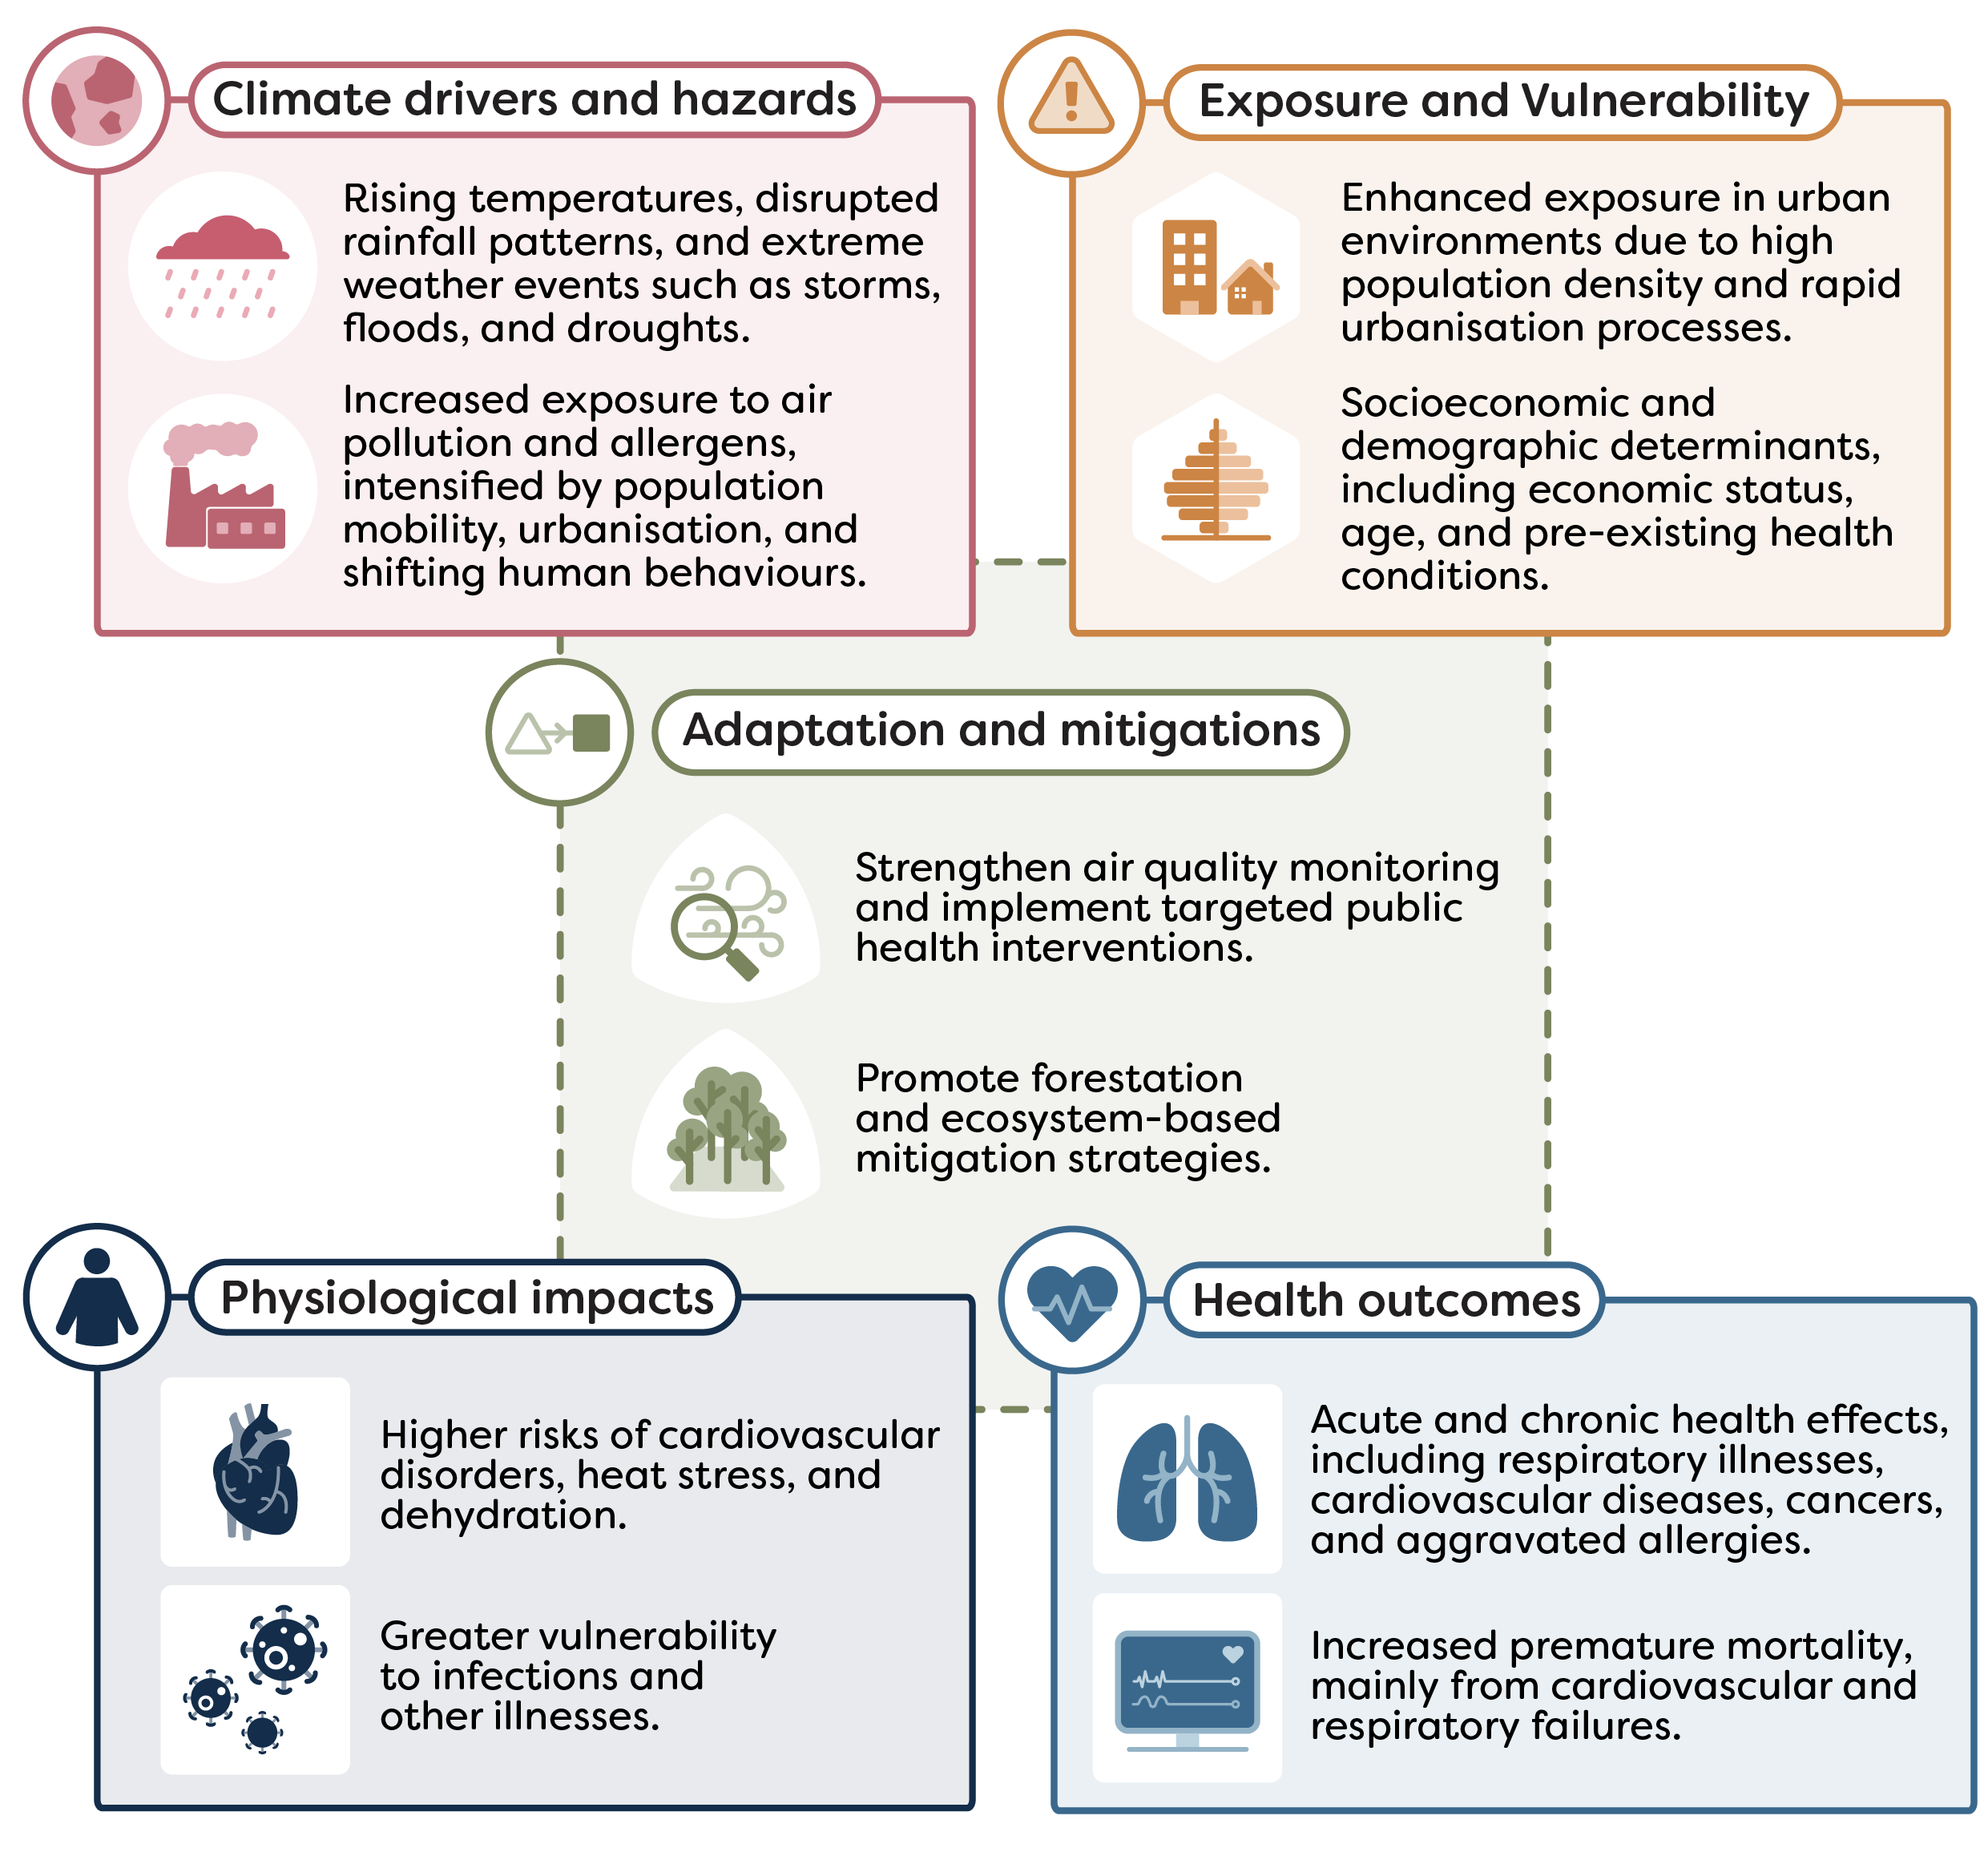
The interplay between climate change and air pollution presents a pressing global health hazard with far-reaching implications for human well-being and environmental sustainability. The health impacts of air pollution by climate change are extensive and multifaceted, impacting individuals in both the short-term and long-term, encompassing a range of acute and chronic conditions.
This topic area aims to quantify the short-term health effects of particulate matter (PM2.5) on all-cause mortality.
UN endorsement
The methods for measuring the headline outcome indicator for this topic were endorsed by the 57th United Nations Statistical Commission to include in the Global Set of Climate Change Statistics and Indicators (see decision 57/109 (b) in the Final Report ). This will be included in the Global Set metadata as:
- Indicator 46: Climate-induced air pollution:
46.1 Mortality attributable to short-term effects of ambient air quality (PM2.5)
The priority indicator for the health effects of air pollution topic is all-cause mortality attributable to short-term exposure to ambient PM2.5
It was agreed to prioritise this indicator as they can provide regular, reliable, and comparable data to monitor climate-related health impacts using state-of-the-art statistical methods.
Further justification for the focus on this indicator is explained in the Topic introduction , which also outlines supplementary and additional indicators that are not in scope for the current SOSCHI framework but are recommended for future development.
The indicator has three component parts:
Relative risk of mortality associated with short-term ambient PM2.5 exposure
Attributable number of all-cause deaths attributable to short-term ambient PM2.5 exposure
Attributable rate of all-cause mortality rate per 100,000 population attributable to short-term ambient PM2.5 exposure
For guidance on the process for calculating these indicator metrics, see the Methodology section below.
This indicator provides insights into how climate-related changes — particularly fine particulate matter (PM2.5)— affect air pollution health outcomes across regions and groups.
While air pollution is influenced by many factors beyond climate alone, PM2.5 is a well-established and sensitive marker of air quality-related health risk that is widely measured across countries and contexts. Estimating mortality attributable to PM2.5 helps quantify the immediate health burden of air pollution and provides evidence to support air quality regulations, emergency response planning, and public health interventions.
This indicator can therefore:
- monitor and quantify health impacts associated with climate-sensitive air pollution exposures
- inform national adaptation plans (NAPs) and resilience strategies
- guide environmental and public health policy, including air quality regulation and health protection measures
The indicator estimates short-term health effects associated with ambient PM2.5 exposure using a Generalised Additive Model (GAM), with parameters estimated by Restricted Maximum Likelihood (REML). The model adjusts for key confounders such as temperature, precipitation, humidity and wind speed, thereby isolating the specific influence of PM2.5. Lag terms are incorporated to account for the possibility that mortality may be influenced not only by same-day exposure but also by exposures on preceding days. This approach allows the model to capture both immediate and delayed health effects, providing a comprehensive assessment of the potential lagged impact of PM2.5 on all-cause mortality. Estimates are first generated at the sub-national level and subsequently aggregated to produce national totals.
Understand the method
Read the Air pollution: methodology for details on the modelling approach, the data needed, and guidance on interpreting results.
Develop bespoke analyses
For flexible, reproducible analysis or to adapt methods to your country or region, use the R package , which provides program code for the priority indicators.
The following data are needed for this indicator production:
- daily all-cause mortality data from national administrative records and civil registration records
- climate data from the National Meteorological Agency
- population estimates from national statistical agencies
Where this data is unavailable or observations are incomplete, proxy datasets may be used. Further information on these potential sources as well as required variable names and formats are outlined in section 2 of the Air pollution: methodology
FAQs
All-cause mortality refers to the total number of deaths in a population from any cause, without distinguishing between specific diseases or conditions. It provides a broad measure of overall population health.
In the context of this topic, all-cause mortality is used because air pollution can contribute to deaths through multiple pathways, most commonly cardiovascular and respiratory conditions.
Short-term exposure refers to exposure to ambient PM2.5 concentrations over a period of days, rather than months or years. Daily PM2.5 levels are analysed, and their effects on mortality are assessed for the same day and up to 14 previous days using lag structures.
This approach captures the short-term health effects of PM2.5 exposure and is particularly suited for identifying the impacts of pollution episodes.
All-cause mortality is a comprehensive health outcome that captures deaths from any cause and is therefore a robust indicator of the overall health impact of air pollution. Short-term exposure to ambient PM2.5 has been shown to increase the risk of death, particularly from cardiovascular and respiratory causes.
Estimating mortality attributable to PM2.5 helps quantify the immediate health burden of air pollution and provides evidence to support air quality regulations, emergency response planning, and public health interventions. However, these estimates reflect population-level risk and do not imply that PM2.5 exposure is the sole cause of any individual death.
PM2.5 consists of very fine particles that can penetrate deep into the lungs and enter the bloodstream, making it especially harmful to human health. A substantial body of scientific evidence links short-term exposure to PM2.5 with an increased mortality risk. PM2.5 is also widely monitored and can be estimated using satellite and modelled data, which makes it suitable for consistent analysis across countries and regions.
By default, the topic uses the World Health Organization (WHO) 24-hour PM2.5 guideline of 15 µg/m³ as the reference level. Users may also apply their national air quality standards if these are more relevant for local policy contexts. The reference level represents a counterfactual scenario: mortality above this level is considered potentially preventable if PM2.5 concentrations were reduced to the reference value.
Daily data are essential because this analysis focuses on short-term health effects, which can vary from day to day. Using daily mortality, PM2.5, and meteorological data allows the model to detect rapid changes in risk following exposure. Daily data also enable flexible aggregation to weekly, monthly, or annual summaries for reporting and communication purposes.
Meteorological factors such as temperature, humidity, precipitation, and wind speed influence both PM2.5 concentrations and human health. If not controlled for, they could confound the estimated relationship between PM2.5 and mortality.
Including these variables helps isolate the specific contribution of PM2.5 to mortality risk and improves the validity of the results.
Disaggregating the results helps identify population groups that are more vulnerable to short-term PM2.5 exposure, such as older adults, young children, or people living in urban areas. This information supports equity-oriented public health policies and enables targeted interventions, rather than one-size-fits-all approaches.
The topic estimates population-level associations and does not measure individual exposure or causation. PM2.5 exposure may be misclassified because the topic does not account for indoor air pollution or individual behaviours, such as staying indoors during high pollution days. In addition, data availability and quality can affect the precision and reliability of the estimates.
The results indicate how many deaths are statistically associated with short-term PM2.5 exposure at the population level, not how many deaths were directly caused by air pollution in a deterministic sense.
These estimates are best used to identify trends, compare regions, assess the scale of the health burden, and inform air quality management and public health planning. They should be interpreted alongside other evidence and local contextual knowledge.
For broader questions that apply across the platform, please see our General FAQs section.
Related Topics
Topic Expert Group
The air pollution topic expert group was set up to review climate and health topics and guide what we measure and how we measure it. The group brings together internal and external specialists who advise on indicators and methods, share subject knowledge so we build on existing work and good practice, and help quality assure draft outputs before publication.
The framework topic documents are a final version produced as part of the SOSCHI project (Wellcome grant no. 224682/Z/21/Z). Please note that as this is an emerging topic area, indicators and methods are subject to change. Notices will be issued on this page to inform users of any changes to the information captured.
For more information on the selection criteria used for prioritising the SOSCHI topics and the development process, see the SOSCHI Framework Page .
We recommend that the proposed indicators, methods and tools (e.g. R code) described on this page can be used for official statistics reporting. See the SOSCHI Framework Page for information on the endorsement of the proposed indicators.
Last updated: 28/05/2026
Airborne disease (CSM)
Climate change is leading to more frequent and intense high temperatures, droughts, and wildfires. These changes promote the spread of certain airborne diseases which are impacted by warm temperatures, dry conditions, dusty winds, overcrowding, and poor sanitation. One airborne disease which is particularly impacted by these conditions is Cerebrospinal Meningitis (CSM). CSM is prevalent in the African Meningitis Belt and has severe health impacts.
Methods for this topic are still in development, therefore a preliminary “Methods Review” document has been published at this stage. This document may be updated to a “Methodology” document depending on the feasibility of ongoing developments and decisions on the final scope of proposed indicators and methods.
This topic area aims to quantify the health impacts of Cerebrospinal Meningitis (CSM) attributable to high temperatures.
The framework topic documents are an alpha version produced as part of the SOSCHI project (Wellcome grant no. 224682/Z/21/Z). Please note that as this is an emerging topic area, indicators and methods are subject to change. Notices will be issued on this page to inform users of any changes to the information captured. For more information on the selection criteria used for prioritising the SOSCHI topics, see the SOSCHI Framework Page for more information on the development process.
The proposed indicators and methods described on this page are not fully ready for implementation within official statistics reporting. The current version has been shared in line with our open-source values – to encourage collaboration, transparency and accessibility allowing users to freely, use, modify and update these guidance materials and tools developed as part of the SOSCHI project.
Waterborne diseases
Contents
Diarrheal disease
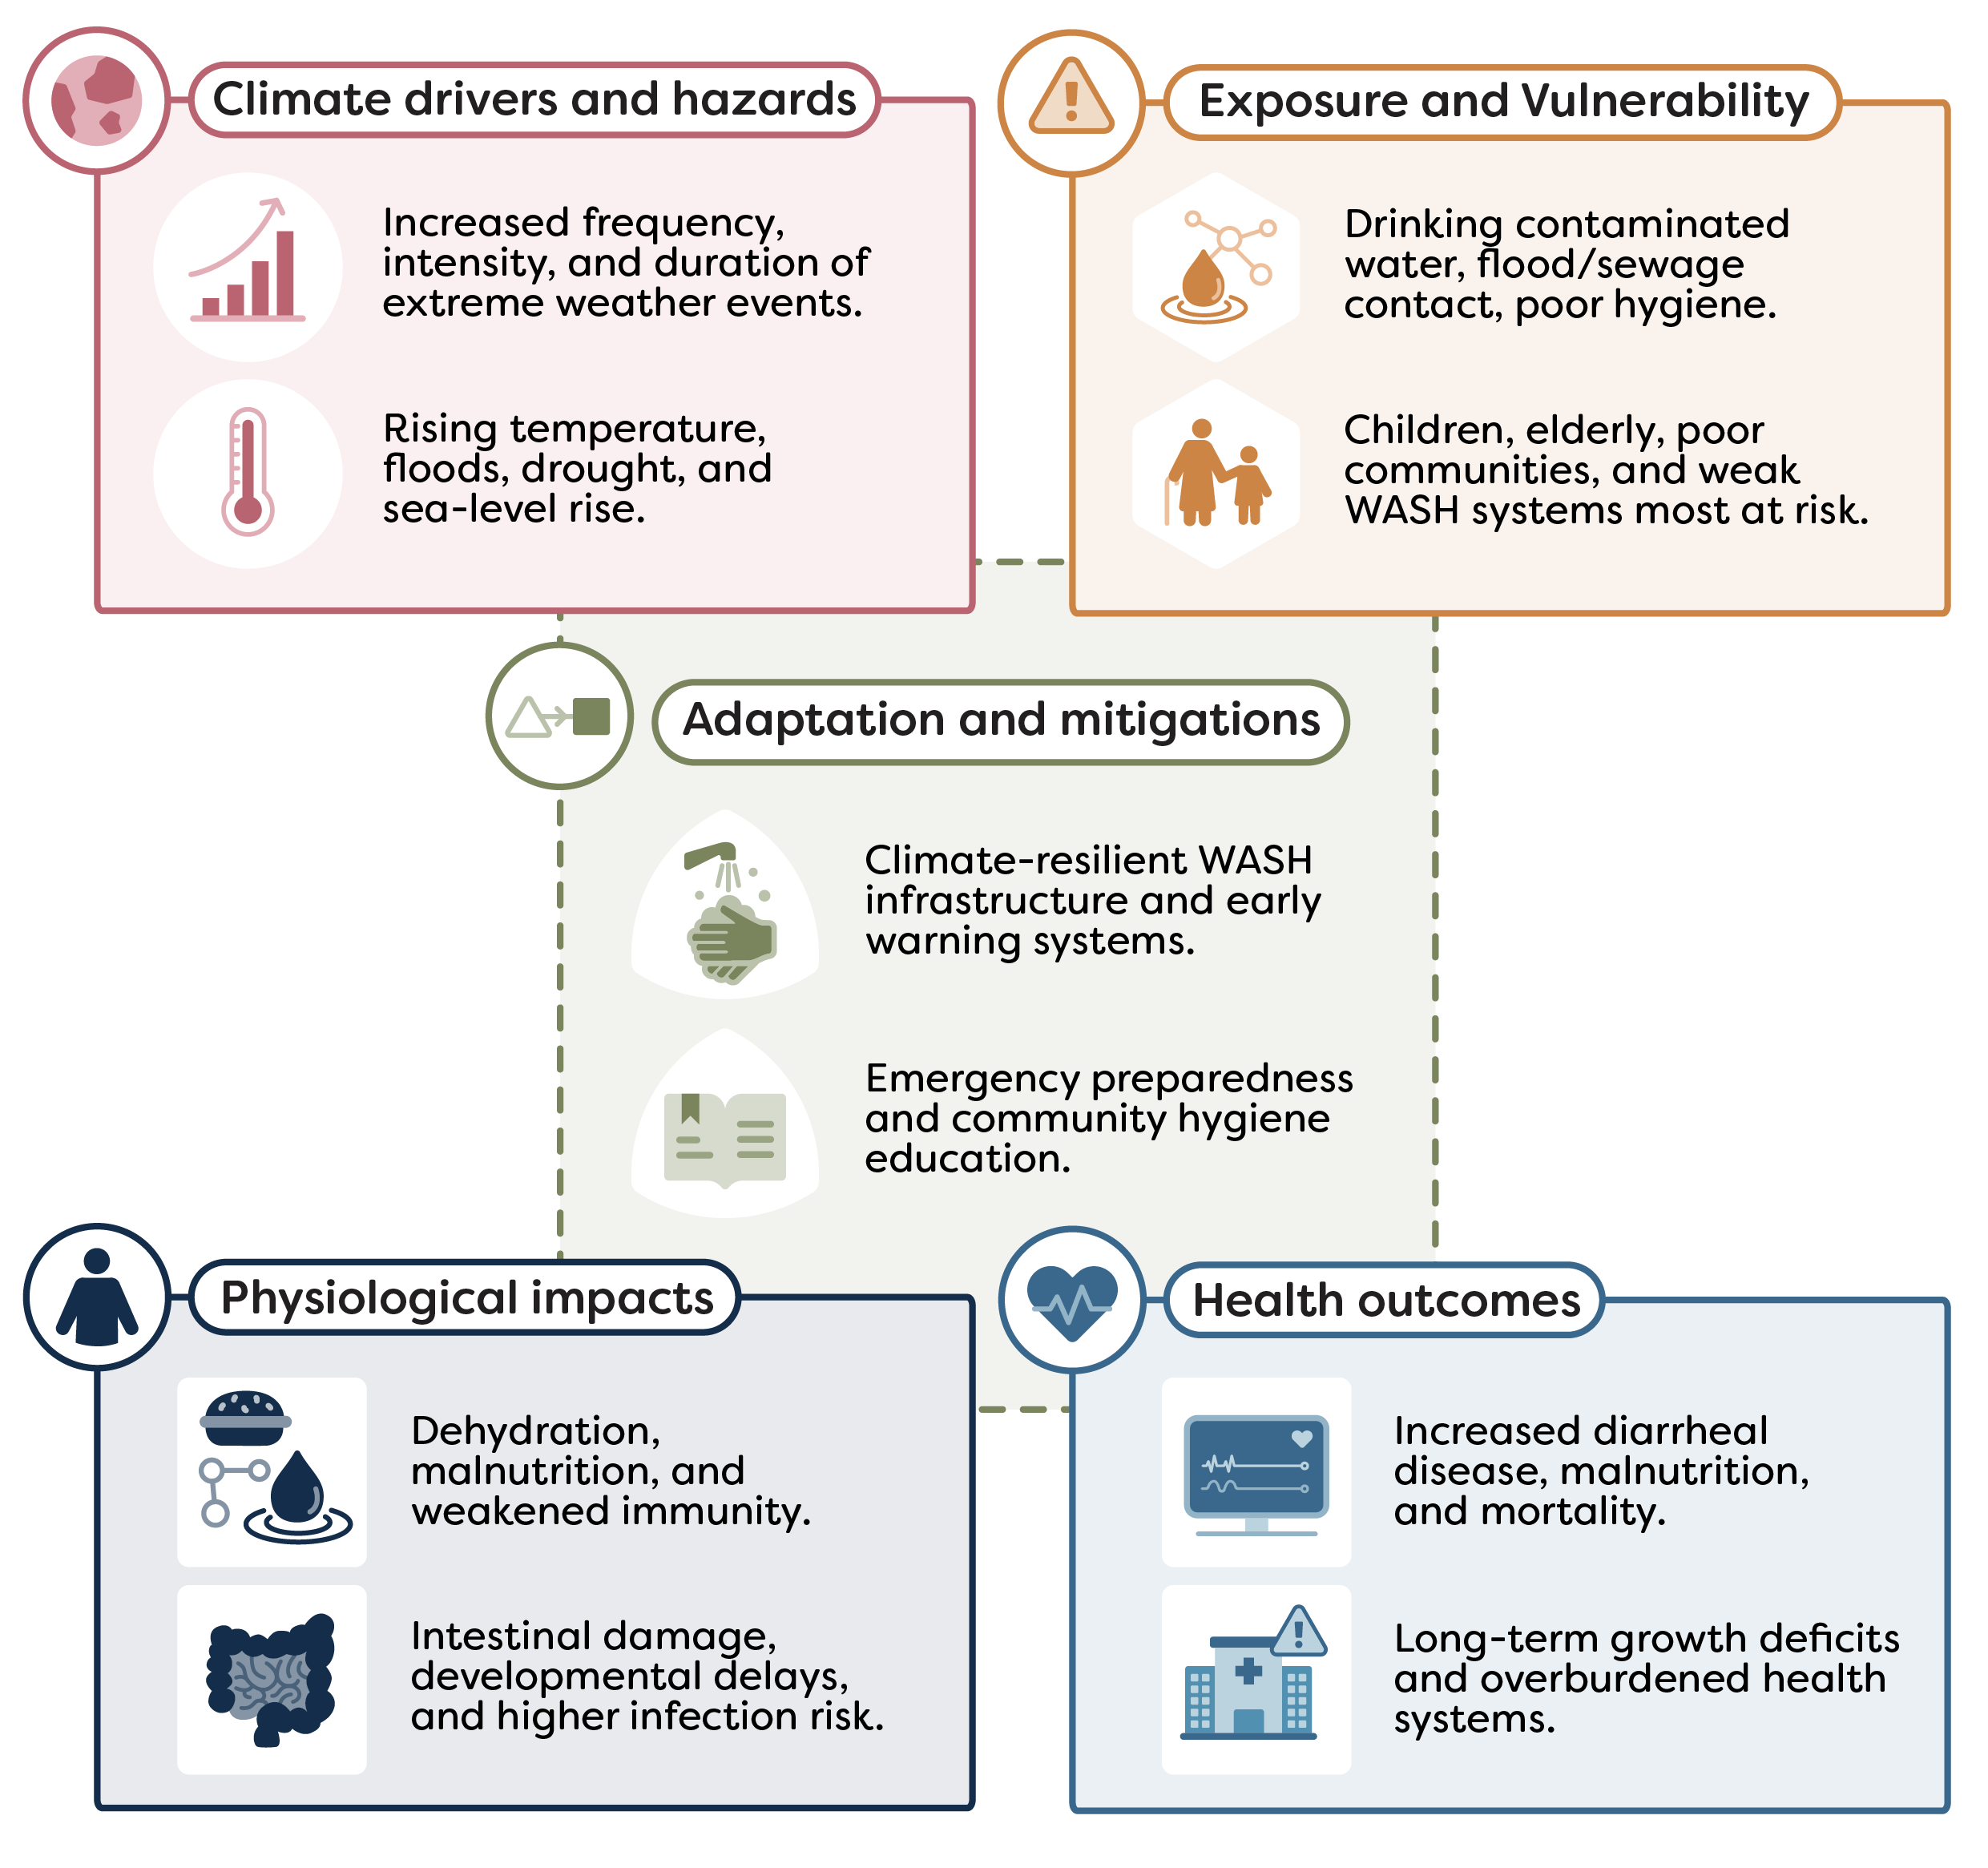
Climate change is leading to more extreme temperatures and rainfall. These changes promote the spread of certain waterborne diseases which are impacted by extreme temperatures, contamination of waterbodies through runoff, dry conditions, water scarcity, and poor sanitation. Diarrheal disease is one of the most prevalent waterborne diseases and is highly impacted by these climatic conditions. Diarrheal disease is a public health concern particularly among young children and in regions of Africa.
This topic area aims to quantify the health impacts of diarrheal disease attributable to extreme temperatures and rainfall.
UN endorsement
The methods for measuring the headline outcome indicator for this topic were endorsed by the 57th United Nations Statistical Commission to include in the Global Set of Climate Change Statistics and Indicators (see decision 57/109 (b) in the Final Report ). This will be included in the Global Set metadata as:
- Indicator 44: Incidence of cases of climate-related disease:
44.1 Incidence of diarrheal disease cases attributable to (a) heat and (b) rainfall
Two priority indicators developed within the waterborne disease and water-related illnesses topic are:
- diarrheal disease incidence attributable to extreme temperature
- diarrheal disease incidence attributable to extreme rainfall
It was agreed to prioritise these indicators as they can provide regular, reliable, and comparable data to monitor climate-related health impacts using state-of-the-art statistical methods.
Further justification for the focus on this indicator is explained in the Topic introduction , which also outlines supplementary and additional indicators that are not in scope for the current SOSCHI framework but are recommended for future development.
Each indicator has four component parts:
Diarrheal disease incidence attributable to extreme temperature
- Relative risk of diarrhea cases attributable to extreme temperature
- Number of diarrhea cases attributable to extreme temperature
- Fraction of diarrhea cases attributable to extreme temperature
- Diarrhea cases per 100,000 population attributable to extreme temperature
Diarrheal disease incidence attributable to extreme rainfall
- Relative risk of diarrhea cases attributable to extreme rainfall
- Number of diarrhea cases attributable to extreme rainfall
- Fraction of diarrhea cases attributable to extreme rainfall
- Diarrhea cases per 100,000 population attributable to extreme rainfall
For guidance on the process for calculating these indicator metrics, see the Methodology section below.
These indicators can give insights into how changes in temperature and extreme rainfall events influence their risk of waterborne diseases, and how these impacts vary geographically and among the most vulnerable groups in society, informing local adaptation needs.
While diarrheal disease incidence does not capture all pathways through which climate change affects health, it is a well established and sensitive indicator of waterborne health impacts, particularly in settings with limited access to safe water, sanitation and hygiene (WASH) services.
This indicator can therefore:
- monitor and quantify the health burden associated with extreme rainfall and extreme temperature through waterborne disease outcomes
- inform national adaptation plans (NAPs) and resilience strategies
- guide environmental and public health policy to reduce risks and improve outcomes
The indicator uses epidemiological methods to examine short-term links between climate exposure and waterborne disease outcomes. The analysis uses a spatiotemporal Bayesian model combined with a Distributed Lag Nonlinear Model (DLNM). The DLNM captures both nonlinear and delayed effects of climate on monthly diarrhea counts, while the Bayesian framework accounts for spatial and temporal correlations.
Understand the method
Read the waterborne disease and water-related illnesses: methodology for details on the modelling approach, the data needed, and guidance on interpreting results.
Develop bespoke analyses
For flexible, reproducible analysis or to adapt methods to your country or region, use the R package , which provides program code for the priority indicators.
Online tools for indicator analysis
Tools for selected indicators are in development. These will allow users to run quick baseline estimates and simple charts without writing code; it supports secure temporary uploads and downloadable outputs.
The following data are needed for this indicator production:
- monthly count of diarrhea reported cases from national administrative records
- climate data from the National Meteorological Agency
- population estimates from national statistical agencies
Where this data is unavailable or observations are incomplete, proxy datasets may be used. Further information on these potential sources as well as required variable names and formats are outlined in section 2 of the Waterborne disease and water-related illnesses: methodology
FAQs
Diarrheal diseases are a key indicator of climate-sensitive waterborne health outcomes. Exposure to extreme temperatures and rainfall can influence diarrhea risk through multiple pathways, including pathogen survival and replication, water contamination, overload of sanitation systems, and changes in hygiene behaviour.
These indicators estimate the burden of diarrhea associated with climate conditions that increase or decrease risk at a monthly time scale, supporting climate adaptation planning, WASH interventions, and public health decision-making. Diarrhea risk is influenced by multiple interacting factors, and extreme temperatures and rainfall represent one component of this broader system.
In the analysis, extreme temperature refers to the monthly maximum temperature, while extreme rainfall refers to the cumulative monthly rainfall. Extreme conditions are identified using relative risk (RR) rather than percentile-based thresholds. Months where RR > 1 are considered harmful, meaning the temperature or rainfall conditions are associated with increased diarrhea risk, while RR < 1 indicates protective conditions with lower risk.
The relative risk is estimated from a statistical model linking monthly diarrhea incidence to monthly maximum temperature and cumulative rainfall. Extremes, therefore, reflect health-relevant risk conditions, rather than rare values in the climate distribution. See Topic introduction for more details.
No. These are model-based attribution estimates, not direct observations of climate-caused diarrhea cases. The analysis models the association between monthly diarrhea counts and monthly maximum temperature and cumulative rainfall, while accounting for delayed and cumulative effects, and spatiotemporal variability at the monthly scale.
“Attributable” refers to the estimated number, rate, or fraction of diarrhea cases associated with months in which climate conditions increase risk. In this analysis, attribution is calculated only for months with a relative risk (RR) greater than 1, indicating harmful temperature or rainfall conditions. It represents the portion of the diarrhea burden that would not have occurred in the absence of these risk-increasing climate conditions, as estimated from the modeled exposure–response relationship.
The analysis uses a spatiotemporal Bayesian model combined with a Distributed Lag Nonlinear Model (DLNM). The DLNM captures both nonlinear and delayed effects of climate on monthly diarrhea counts, while the Bayesian framework accounts for spatial and temporal correlations.
This combination enables robust estimates of relative risk and attributable burden across multiple locations over time using the R-INLA package. Depending on the dataset size and spatial coverage, running the model can take 3 to 5 minutes.
The reliability of these estimates depends on the quality of monthly diarrhea case data, the representativeness of monthly maximum temperature and cumulative rainfall, and the strength of the modeled climate–diarrhea relationship.
Reliability is strengthened because the model can:
- borrow strength across space and time, producing more stable estimates in areas or months with low case counts
- capture delayed and nonlinear effects of temperature and rainfall on diarrhea risk, reflecting cumulative or lagged impacts rather than only immediate associations
- account for spatial and temporal correlations, recognizing that diarrhea risk is related across neighboring regions and adjacent months
- quantify uncertainty rigorously through credible intervals, which incorporate variability from the data, model structure, and parameter estimation
While this approach improves robustness compared with raw counts alone, users should still interpret results cautiously, particularly at sub-national scales or for smaller populations. Detailed methodological limitations are described in waterborne disease and water-related illnesses: methodology.
Yes, waterborne diarrhea indicators are produced at multiple spatial levels, including national, regional, and district scales, and for key sub-populations such as children under five years of age.
Estimates for the under-five population are considered reliable because diarrhea incidence is higher in this group, providing sufficient data for stable modeling. As with all analyses, uncertainty intervals (credible intervals) should still be considered when interpreting results, particularly at finer spatial scales.
For broader questions that apply across the platform, please see our General FAQs section.
Related Topics
Topic Expert Group
The waterborne disease and water-related illnesses topic expert group was set up to review this topic and guide what we measure and how we measure it. The group brings together internal and external specialists who advise on indicators and methods, share subject knowledge so we build on existing work and good practice, and help quality assure draft outputs before publication.
The framework topic documents are a final version produced as part of the SOSCHI project (Wellcome grant no. 224682/Z/21/Z). Please note that as this is an emerging topic area, indicators and methods are subject to change. Notices will be issued on this page to inform users of any changes to the information captured.
For more information on the selection criteria used for prioritising the SOSCHI topics and the development process, see the SOSCHI Framework Page .
We recommend that the proposed indicators, methods and tools (e.g. R code) described on this page can be used for official statistics reporting. See the SOSCHI Framework Page for information on the endorsement of the proposed indicators.
Last updated: 30/04/2026
Exposure to chemical contaminants
Climate change is leading to more extreme temperatures, precipitation, and weather events. These changes impact the presence of harmful chemicals in the environment through factors such as contamination of waterbodies through runoff, reduced dilution of waterbodies, and greater use of agricultural chemicals to support crop and cattle yield in warm and dry conditions. Exposure to these contaminants is linked with a range of health outcomes.
This topic introduction provides an overview of the process we took to identify a climate-health chemical contaminants indicator.
This process identified significant limitations in data availability and knowledge within this field. As a result, the SOSCHI framework will not include an indicator on chemical contaminants. We make recommendations for future developments within the field and highlight Harmful Algal Blooms as a potential future indicator.
The framework topic documents are an alpha version produced as part of the SOSCHI project (Wellcome grant no. 224682/Z/21/Z). Please note that as this is an emerging topic area, indicators and methods are subject to change. Notices will be issued on this page to inform users of any changes to the information captured. For more information on the selection criteria used for prioritising the SOSCHI topics, see the SOSCHI Framework Page for more information on the development process.
The proposed indicators and methods described on this page are not fully ready for implementation within official statistics reporting. The current version has been shared in line with our open-source values – to encourage collaboration, transparency and accessibility allowing users to freely, use, modify and update these guidance materials and tools developed as part of the SOSCHI project.
Vector-borne diseases
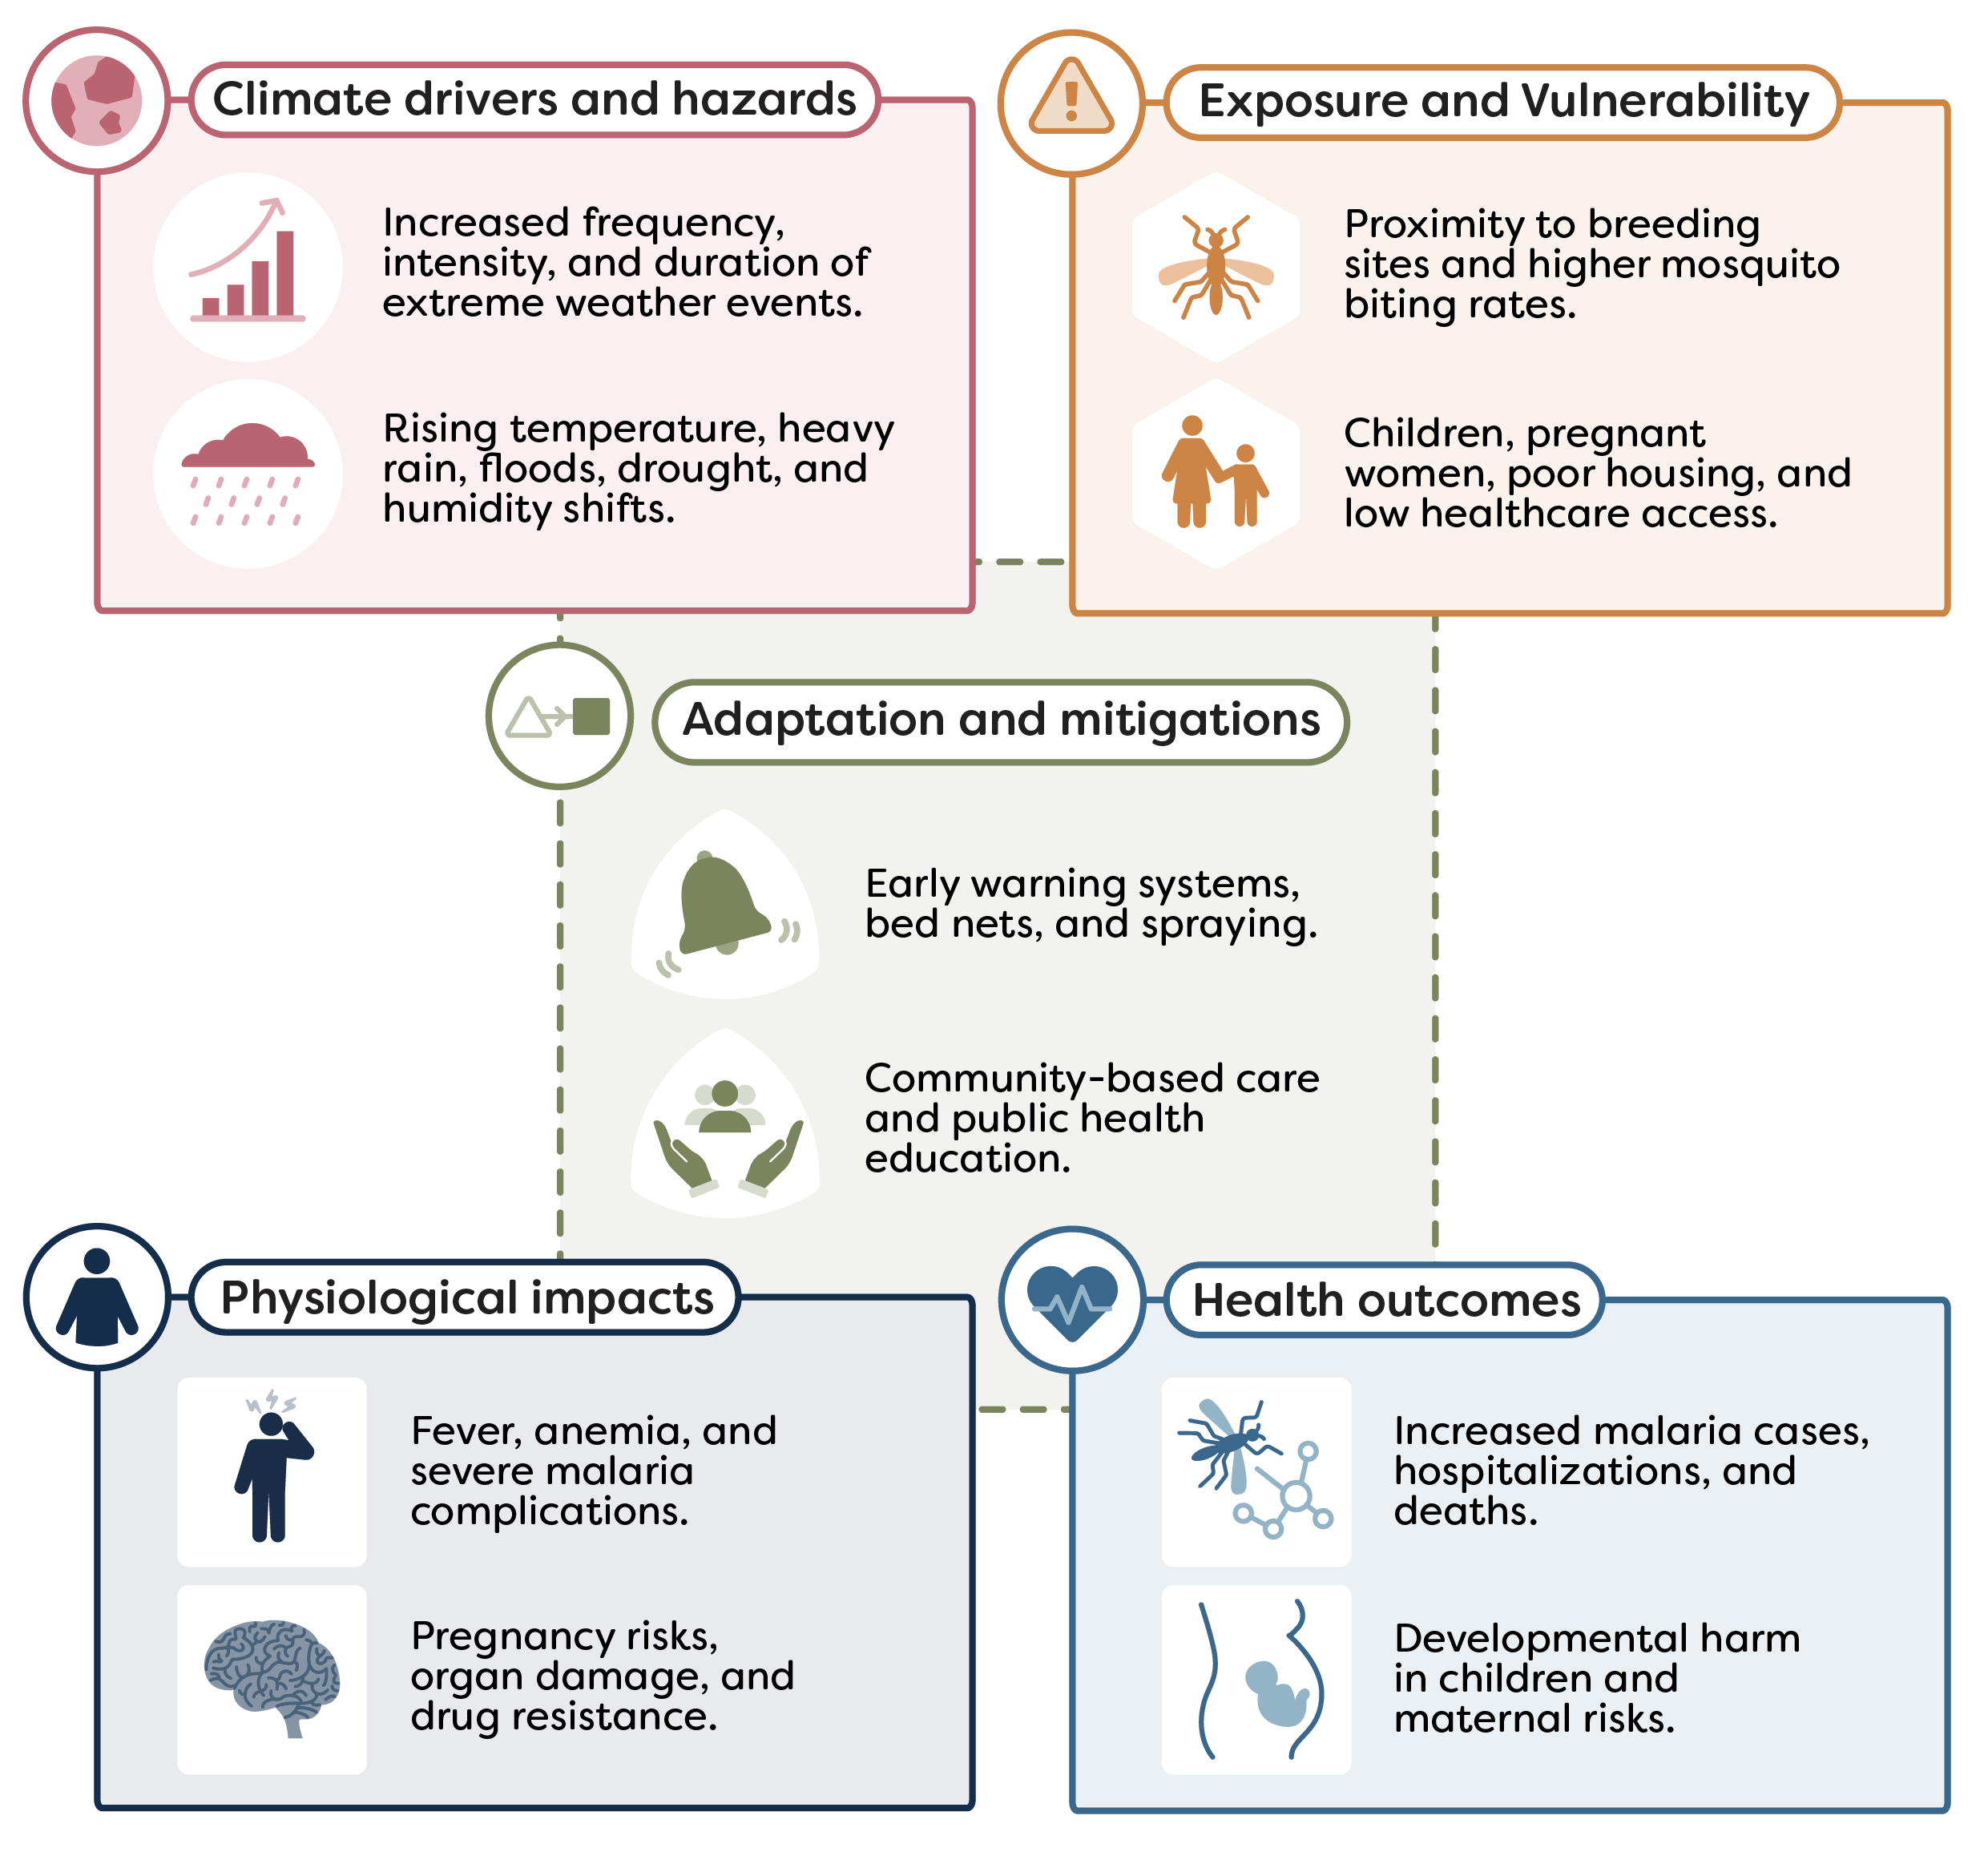
Climate change is leading to more extreme temperatures and rainfall. These changes promote the spread of certain vector-borne diseases which are impacted by warmer temperatures, humidity, and heavy rainfall. Malaria is a significant public health issue, particularly in tropical and subtropical regions, and is highly impacted by these climatic changes.
This topic area aims to quantify the health impacts of malaria attributable to extreme temperatures and rainfall.
UN endorsement
The methods for measuring the headline outcome indicator for this topic were endorsed by the 57th United Nations Statistical Commission to include in the Global Set of Climate Change Statistics and Indicators (see decision 57/109 (b) in the Final Report ). This will be included in the Global Set metadata as:
- Indicator 44: Incidence of cases of climate-related disease:
44.2 Incidence of malaria cases attributable to (a) heat and (b) rainfall
Two priority indicators developed within the vector-borne diseases topic are:
- malaria incidence attributable to extreme temperature
- malaria incidence attributable to extreme rainfall
It was agreed to prioritise these indicators as they can provide regular, reliable, and comparable data to monitor climate-related health impacts using state-of-the-art statistical methods.
Further justification for the focus on this indicator is explained in the Topic introduction , which also outlines supplementary and additional indicators that are not in scope for the current SOSCHI framework but are recommended for future development.
Each indicator has four component parts:
Malaria incidence attributable to extreme temperature
- Relative risk of malaria cases attributable to extreme temperature
- Number of malaria cases attributable to extreme temperature
- Fraction of malaria cases attributable to extreme temperature
- Malaria cases per 100,000 population attributable to extreme temperature
Malaria incidence attributable to extreme rainfall
- Relative risk of malaria cases attributable to extreme rainfall
- Number of malaria cases attributable to extreme rainfall
- Fraction of malaria cases attributable to extreme rainfall
- Malaria cases per 100,000 population attributable to extreme rainfall
For guidance on the process for calculating these indicator metrics, see the Methodology section below.
These indicators can give insights into how changes in extreme temperature and rainfall events influence the transmission and burden of vector-borne diseases, and how these impacts vary geographically and among the most vulnerable groups in society, informing local adaptation needs.
While malaria incidence does not capture all pathways through which climate change affects health, it is a well-established and sensitive indicator of vector-borne disease risk, particularly in settings where proximity to mosquito breeding sites and high mosquito bites interact to increase transmission risk.
This indicator can therefore:
- monitor and quantify the health burden associated with extreme rainfall and extreme temperature through vector-borne disease outcomes
- inform national adaptation plans (NAPs) and resilience strategies
- guide environmental and public health policy to reduce risks and improve outcomes
The indicator uses epidemiological methods to examine short-term links between climate exposure and vector-borne disease outcomes. The analysis uses a spatiotemporal Bayesian model combined with a Distributed Lag Nonlinear Model (DLNM). This approach captures both nonlinear and delayed effects of climate on monthly malaria cases while accounting for spatial and temporal patterns in transmission.
Understand the method
Read the vector-borne diseases: methodology for details on the modelling approach, the data needed, and guidance on interpreting results.
Develop bespoke analyses
For flexible, reproducible analysis or to adapt methods to your country or region, use the R package , which provides program code for the priority indicators.
Online tools for indicator analysis
Tools for selected indicators are in development. These will allow users to run quick baseline estimates and simple charts without writing code; it supports secure temporary uploads and downloadable outputs.
The following data are needed for this indicator production:
- monthly count of malaria cases from national administrative records
- climate data from the National Meteorological Agency
- population estimates from national statistical agencies
Where this data is unavailable or observations are incomplete, proxy datasets may be used. Further information on these potential sources as well as required variable names and formats are outlined in section 2 of the Vector-borne diseases: Methodology
FAQs
Malaria is a climate-sensitive vector-borne disease, influenced by environmental conditions that affect mosquito and parasite dynamics. Variations in temperature and rainfall can alter mosquito survival, biting rates, and parasite development, thereby changing malaria transmission risk.
These indicators quantify the portion of malaria burden associated with climate conditions that increase risk on a monthly basis, helping guide vector control, public health planning, and adaptation strategies. Malaria incidence is affected by multiple factors, and climate is one component within this complex system.
In this analysis, extreme temperature refers to the monthly maximum temperature, while extreme rainfall refers to the total monthly rainfall. Extreme conditions are determined using relative risk (RR) rather than rare or percentile-based weather events.
Months where RR > 1 are considered harmful, meaning they increase malaria risk, while RR < 1 indicates months associated with lower risk. The RR is derived from a model linking monthly malaria counts to climate conditions, so extremes represent health-relevant risk levels rather than purely unusual weather. See the Vector-borne diseases: Methodology for more details.
No. These are model-based attribution estimates, not observed cases directly caused by climate. The analysis evaluates the relationships between monthly malaria incidence and monthly maximum temperature and cumulative rainfall, while accounting for delayed effects and regional and seasonal variation.
“Attributable” indicates the number, rate, or fraction of malaria cases associated with months in which climate conditions increase risk. Attribution is calculated only for months where RR > 1, reflecting harmful temperature or rainfall conditions. It represents the estimated proportion of malaria cases that could be prevented if climate risk factors were not within the harmful temperature range (RR > 1), based on the modeled exposure-response relationship. See Vector-borne diseases: Methodology for more details.
The analysis uses a spatiotemporal Bayesian modeling framework combined with a Distributed Lag Nonlinear Model (DLNM). This approach captures both nonlinear and delayed effects of climate on monthly malaria cases while accounting for spatial and temporal patterns in transmission.
The combination produces reliable relative risk and attributable burden estimates across multiple locations and months using the R-INLA package. Depending on the dataset size, running the model typically takes 3 to 5 minutes.
The estimates are strengthened by the model’s ability to handle variations in malaria incidence and climate exposure across regions and months.
Key aspects of reliability include:
- combining information across locations and time to stabilize estimates in areas or months with few cases
- capturing delayed and nonlinear responses of malaria risk to temperature and rainfall, reflecting cumulative effects
- accounting for spatial and temporal correlations across neighboring regions and months
- providing uncertainty estimates through credible intervals, which incorporate data variability and model assumptions
Yes, malaria indicators are produced at national, regional, and district levels, as well as for key sub-populations, including children under five years of age. Estimates for the under-five population are reliable because higher case counts provide stable modeling. As with all outputs, credible intervals should be considered when interpreting results, particularly in smaller areas.
For broader questions that apply across the platform, please see our General FAQs section.
Related Topics
Topic Expert Group
The vector-borne diseases topic expert group was setup to review this topic and guide what we measure and how we measure it. The group brings together internal and external specialists who advise on indicators and methods, share subject knowledge so we build on existing work and good practice, and help quality assure draft outputs before publication.
The framework topic documents are a final version produced as part of the SOSCHI project (Wellcome grant no. 224682/Z/21/Z). Please note that as this is an emerging topic area, indicators and methods are subject to change. Notices will be issued on this page to inform users of any changes to the information captured.
For more information on the selection criteria used for prioritising the SOSCHI topics and the development process, see the SOSCHI Framework Page .
We recommend that the proposed indicators, methods and tools (e.g. R code) described on this page can be used for official statistics reporting. See the SOSCHI Framework Page for information on the endorsement of the proposed indicators.
Last updated: 07/05/2026
Undernutrition
Climate change is leading to more extreme temperatures, precipitation, and other weather events. These changes exacerbate conditions which lead to undernutrition, a health condition resulting from an imbalance in dietary intake, where nutrients are either insufficiently or overly consumed, leading to adverse health effects. Conditions which impact undernutrition include soil fertility, crop and livestock production and diversity, food and water security, and sanitation.
This topic area aims to quantify the health impacts of undernutrition attributable to extreme temperatures, precipitation, and drought.
Methods for this topic are still in development, therefore a preliminary “Methods Review” document has been published at this stage. This document may be updated to a “Methodology” document depending on the feasibility of ongoing developments and decisions on the final scope of proposed indicators and methods.
The framework topic documents are an alpha version produced as part of the SOSCHI project (Wellcome grant no. 224682/Z/21/Z). Please note that as this is an emerging topic area, indicators and methods are subject to change. Notices will be issued on this page to inform users of any changes to the information captured. For more information on the selection criteria used for prioritising the SOSCHI topics, see the SOSCHI Framework Page for more information on the development process.
The proposed indicators and methods described on this page are not fully ready for implementation within official statistics reporting. The current version has been shared in line with our open-source values – to encourage collaboration, transparency and accessibility allowing users to freely, use, modify and update these guidance materials and tools developed as part of the SOSCHI project.
Mental health
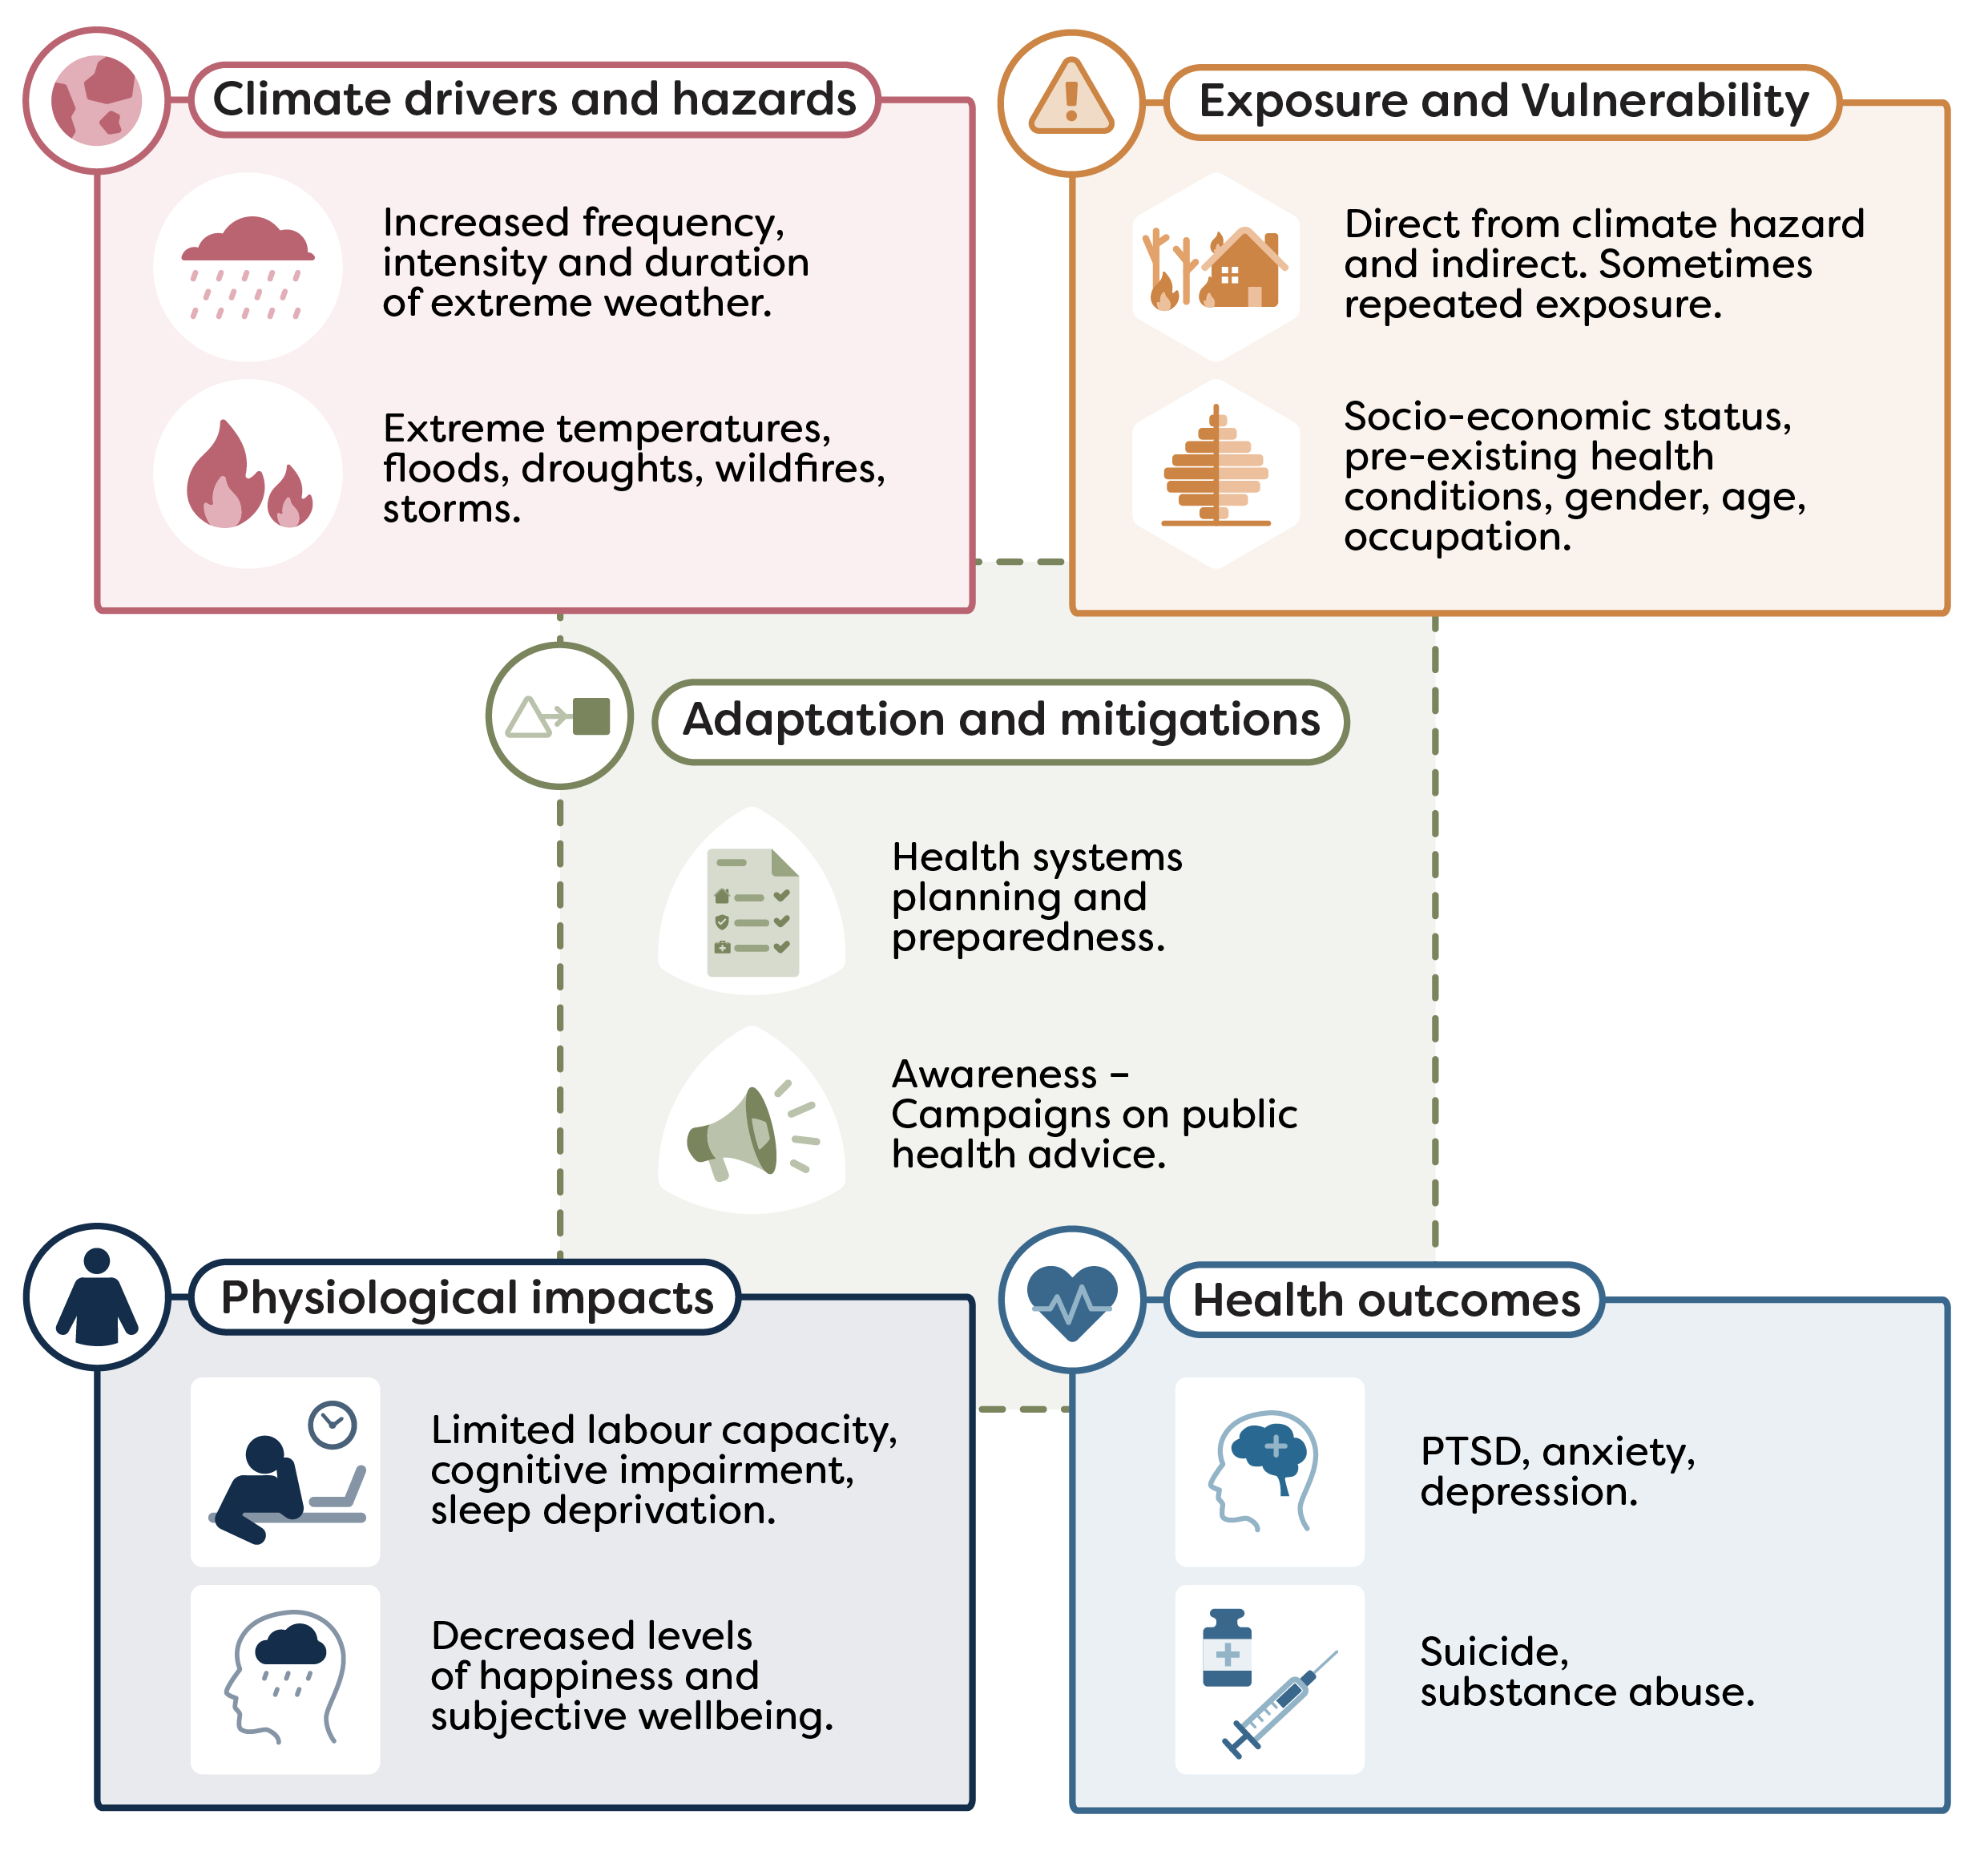
Climate change is leading to more frequent and extreme climate-related hazards that influence mental health outcomes. Direct impacts on mental health can arise from increased exposure to extreme temperatures and extreme weather events. Indirect impacts can be due to displacement, malnutrition, conflict, climate-related economic and social losses, along with anxiety and distress associated with worry about climate change.
This topic area aims to quantify the mental health impacts, currently focused on suicides attributable to extreme temperatures.
UN endorsement
The methods for measuring the headline outcome indicator for this topic were endorsed by the 57th United Nations Statistical Commission to include in the Global Set of Climate Change Statistics and Indicators (see decision 57/109 (b) in the Final Report ). This will be included in the Global Set metadata as:
- Indicator 45: Incidence of heat and cold related illnesses or excess mortality:
45.2 Mortality from suicide attributable to excess heat (proxy for mental health)
The priority indicator developed within the mental health topic is suicides attributable to extreme heat.
It was agreed to prioritise this indicator as defining exposure is simpler for extreme heat than other extreme weather events, as ambient temperature data across countries and regions are generally widely available. While suicide was selected as a health outcome due to its clearer diagnostic coding and more consistent reporting compared to hospitalisations for example.
Further justification for the focus on this indicator is explained in the Topic introduction , which also outlines supplementary and additional indicators that are not in scope for the current SOSCHI framework but are recommended for future development.
The indicator has four component parts:
Relative risk of suicide associated with temperature
Number of suicides attributable to extreme heat
Percentage of suicides attributable to extreme heat
Rate of suicide per 100,000 population attributable to extreme heat
For guidance on the process for calculating these indicator metrics, see the Methodology section below.
This indicator can give insights into how more frequent and intense hot days may be impacting mental health and how this varies geographically and among the most vulnerable groups in society, informing local adaptation needs.
While suicide is not a direct measure of the incidence or prevalence of mental health conditions, it is a useful proxy for some types of mental health challenges which may be exacerbated by extreme heat.
This indicator can therefore:
- monitor and quantify, to some extent, the mental health impacts of extreme heat
- inform national adaptation plans (NAPs) and resilience strategies
- guide environmental and public health policy to reduce risks and improve outcomes
The indicator uses epidemiological methods to examine short-term links between daily temperature and suicide deaths. A time stratified case crossover design is combined with a distributed lag non-linear model (DLNM) to assess the relative risk of suicide by temperature exposure. Further estimation using this relationship is done to attribute suicides to extreme heat exposure.
Understand the method
Read the suicides attributable to extreme heat: methodology for details on the modelling approach, the data needed, and guidance on interpreting results.
Develop bespoke analysis
For flexible, reproducible analysis or to adapt methods to your country or region, use the R package , which provides program code for the priority indicators.
Online tools for indicator analysis
Tools for selected indicators are in development. These will allow users to run quick baseline estimates and simple charts without writing code; it supports secure temporary uploads and downloadable outputs.
The following data are needed for this indicator production:
- daily mortality data on suicides from national administrative records
- population estimates from national statistical agencies
- daily mean temperature and other optional climatic variables from government meteorological offices
Where this data is unavailable or observations are incomplete, proxy datasets may be used. Further information on these potential sources as well as required variable names and formats are outlined in section 2 of the suicides attributable to extreme heat: methodology
FAQs
While suicide is not a direct measure of the incidence or prevalence of mental health conditions, it is a useful proxy for some types of mental health challenges which may be exacerbated by extreme heat.
These estimates can give insights into how more frequent and intense hot days may be impacting mental health and can help to inform adaptation needs. However, it is important to be aware that the exact mechanism by which heat affects the risk of suicide is not yet understood.
It was agreed with our expert advisory group that the mental health impacts of extreme heat are a sensible place to start. Defining exposure is simpler for extreme heat than other extreme weather events, while ambient temperature data across countries and regions are generally widely available. Adaptation of commonly applied methods in existing studies could also be done.
Suicides as an outcome was selected to be focused on over hospitalisations due to its clearer diagnostic coding and more consistent reporting. However, it is important to be aware of national differences in suicide occurrence and recording which may relate to legal, cultural and other differences.
The indicator analysis can be run using the online platform tool, or the ‘climatehealth’ R package. Please note that the R package provides users with more flexibility to update the parameters specified in the analysis pipeline. Please see the suicides attributable to extreme heat: methodology for more detail.
Due to the nature of the case-crossover methodology, the indicator will only work with daily input data.
As a default in the model, extreme heat is defined as days where the temperature was in the top 2.5% (97.5th percentile and above) of daily temperatures. This is based on the temperature distribution over the whole time series provided for each geographical area. The word ‘extreme’ therefore refers to the relative rarity of these higher temperatures to the corresponding area, not to an absolute value, which would vary across the world.
No, these are estimates based on a statistical model. These are produced by modelling the association between daily suicide occurrences and daily mean temperature. This association is then used to estimate the attribution to extreme heat. As these are modelled estimates there are uncertainty around the statistics that should be considered in any interpretation of results.
Dependent on the type of estimate, this is the number, rate (per 100,000 population) or proportion of suicides that would not have occurred if there had been no exposure to extreme heat.
It is based on the risk of suicide from the modelled temperature-suicide association above the defined threshold of extreme heat. This threshold can be altered by a user if needed to accommodate differing relationships.
A negative attributable number can suggest that, in the context of the model, extreme heat is associated with a reduction in suicide rates, indicating an inverse relationship. Though any uncertainty around these estimates should be considered in this interpretation.
The analysis uses daily suicide counts to model temperature-related impacts. As suicide is generally relatively infrequent as a cause of death in the population as a whole, numbers can be low, especially at sub-national levels, contributing to uncertainty around the estimates. Confidence intervals and statistics on model validation should be considered when interpreting results.
More information on data and methodological limitations can be found in suicides attributable to extreme heat: methodology
Users can run the analysis on sub-populations such as by age group or sex. This is providing they have the relevant variables, as set out in the data template in suicides attributable to extreme heat: methodology
However, users should be aware that breaking down estimates into smaller groups can limit the reliability of statistical modelling and potentially lead to wide uncertainty in the estimates
For broader questions that apply across the platform, please see our General FAQs section.
Related Topics
Topic Expert Group
The mental health topic expert group is one of ten groups set up during discovery to review climate and health topics and guide what we measure and how we measure it. The group brings together internal and external specialists who advise on indicators and methods, share subject knowledge so we build on existing work and good practice, and help quality assure draft outputs before publication.
The framework topic documents are a final version produced as part of the SOSCHI project (Wellcome grant no. 224682/Z/21/Z). Please note that as this is an emerging topic area, indicators and methods are subject to change. Notices will be issued on this page to inform users of any changes to the information captured.
For more information on the selection criteria used for prioritising the SOSCHI topics and the development process, see the SOSCHI Framework Page .
We recommend that the proposed indicators, methods and tools (e.g. R code) described on this page can be used for official statistics reporting. See the SOSCHI Framework Page for information on the endorsement of the proposed indicators.
Last updated: 21/05/2026
Healthcare systems and facilities
Healthcare systems include a broad range of activities from public health initiatives to services, covering both private and public sectors. Globally, healthcare systems are under significant pressure which are further compounded by the effects of climate change. These can be direct impacts to infrastructure as well as disruption to medical supply and service delivery.
The ability of facilities to function, particularly in vulnerable regions, during extreme conditions such as flooding, heatwaves and storms determines the effectiveness of these systems in mitigating the impacts of climate change on public health.
This topic area follows a different approach to the wider framework, aiming to use qualitative methods to assess the impact on health workforce, infrastructure and technology as well as service delivery.
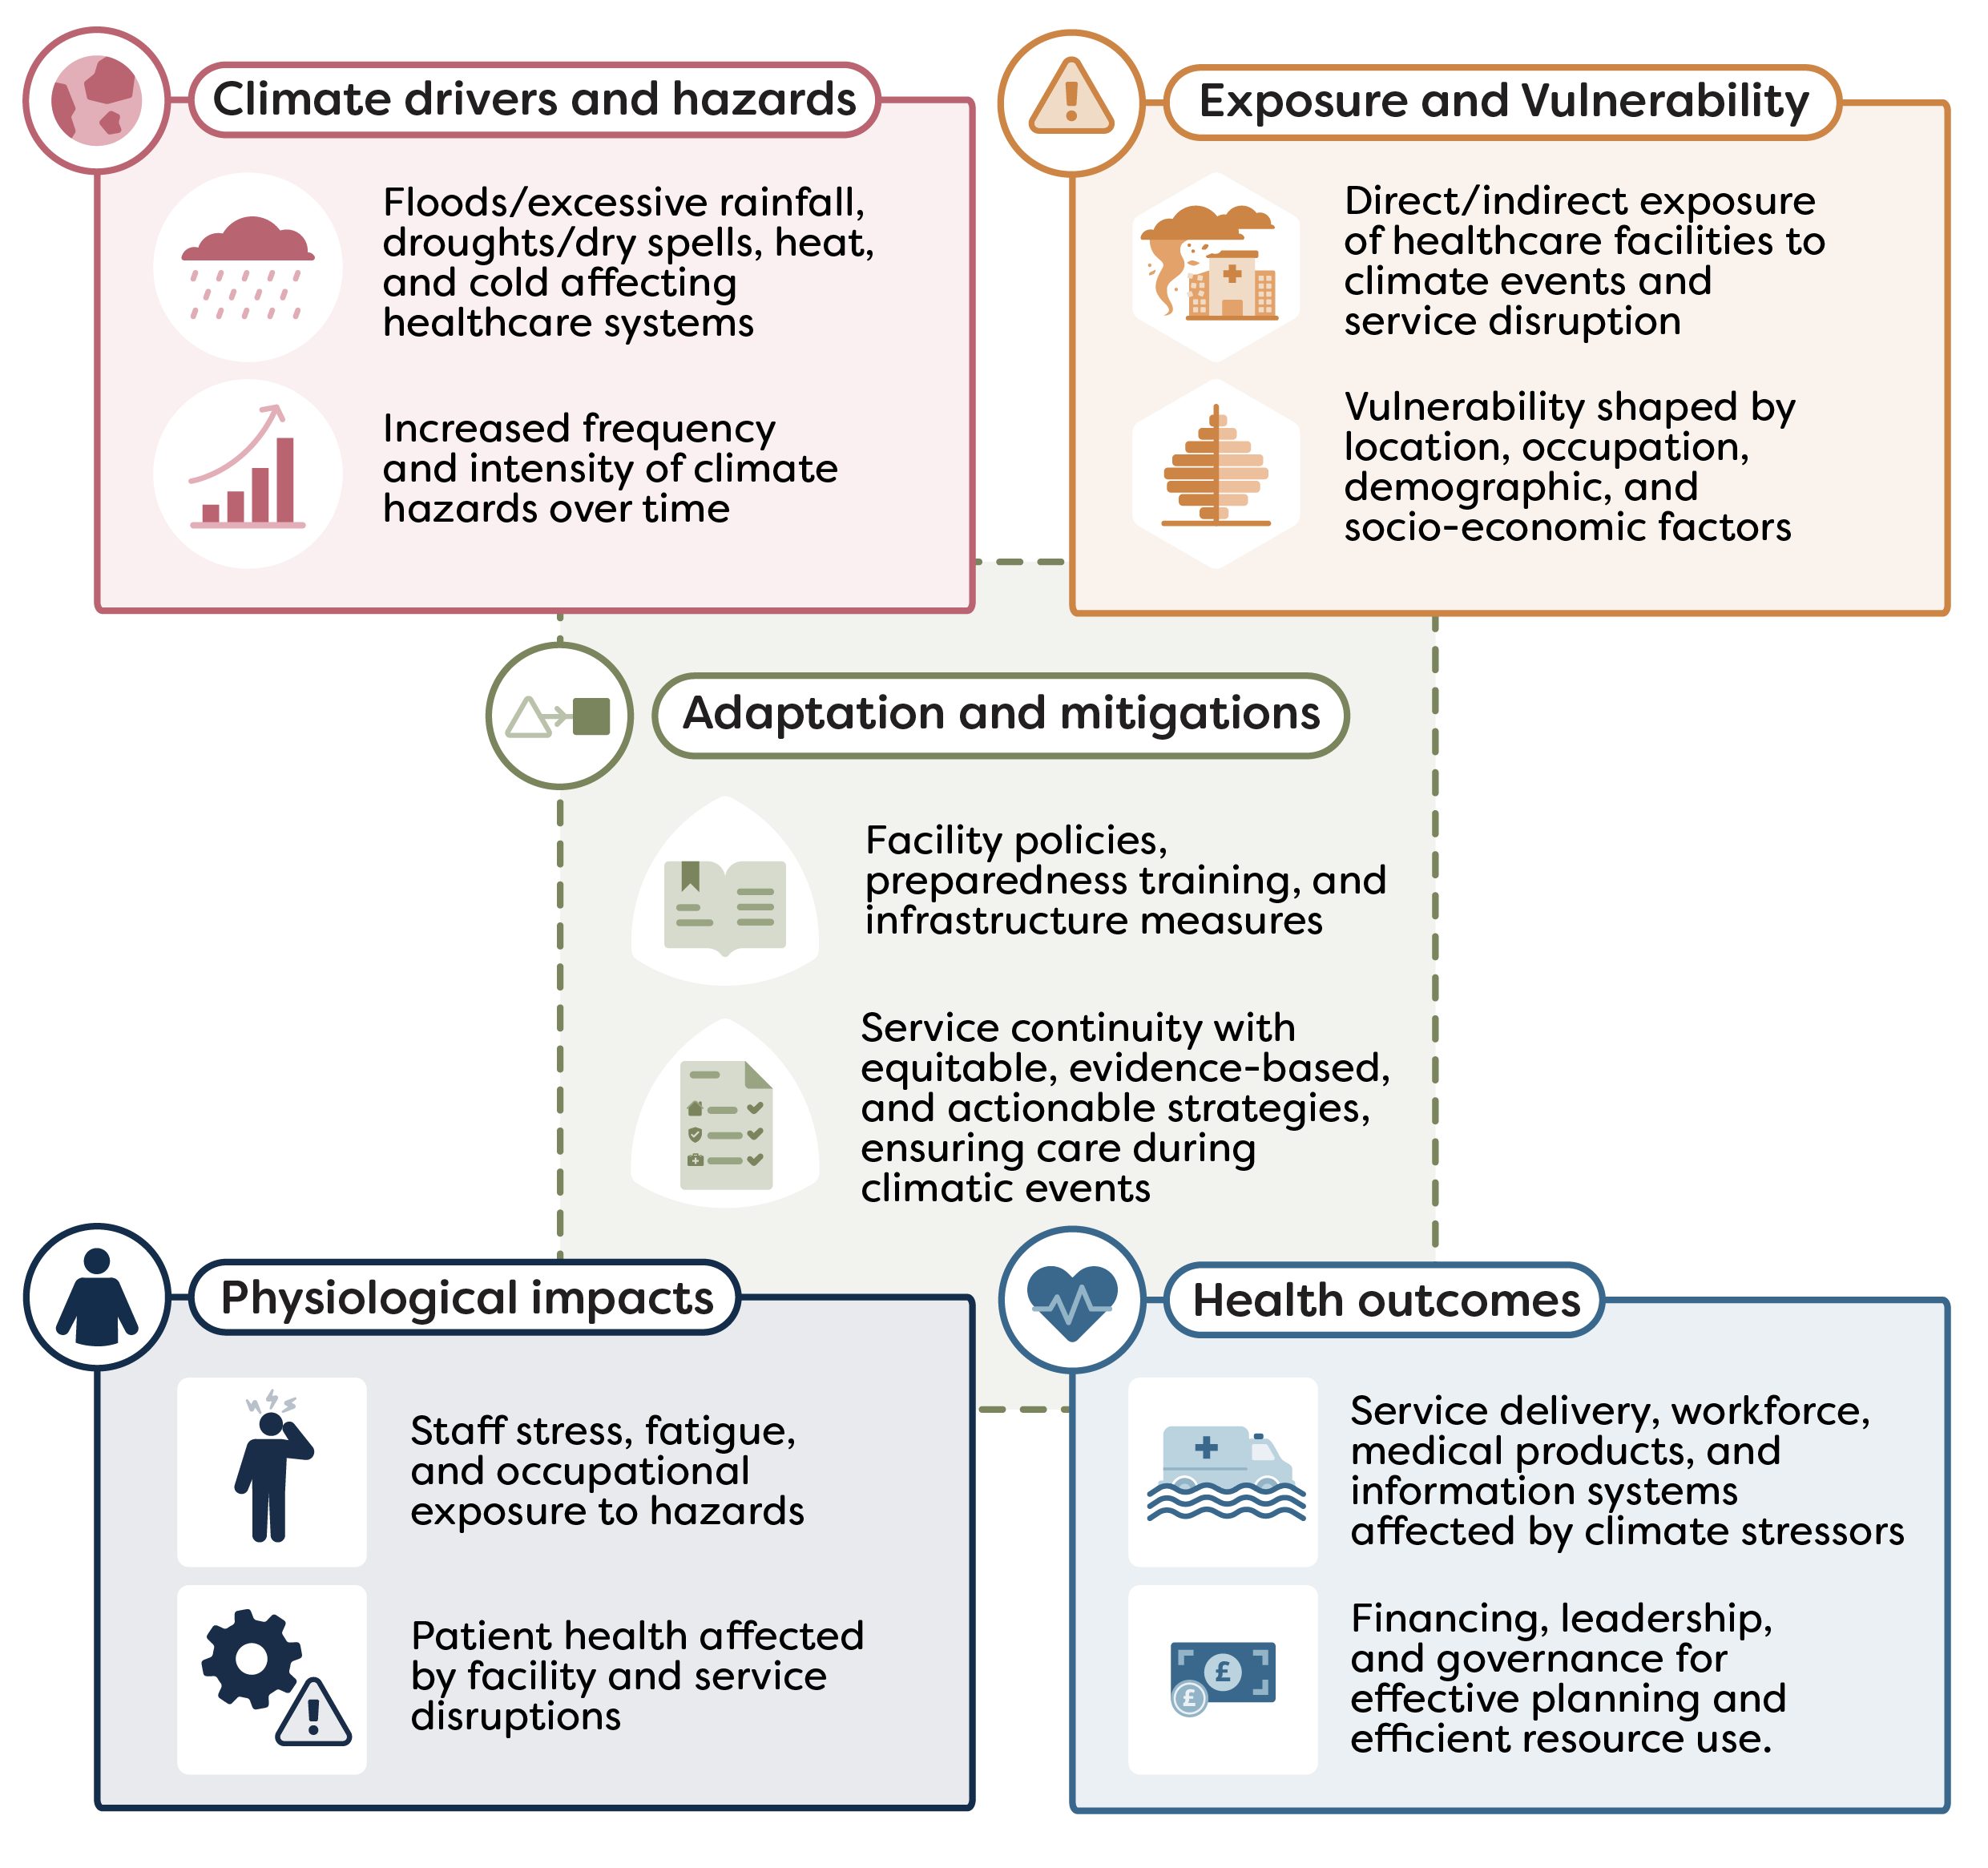
The framework topic documents are an alpha version produced as part of the SOSCHI project (Wellcome grant no. 224682/Z/21/Z). Please note that as this is an emerging topic area, indicators and methods are subject to change. Notices will be issued on this page to inform users of any changes to the information captured. For more information on the selection criteria used for prioritising the SOSCHI topics, see the SOSCHI Framework Page for more information on the development process.
The proposed indicators and methods described on this page are not fully ready for implementation within official statistics reporting. The current version has been shared in line with our open-source values – to encourage collaboration, transparency and accessibility allowing users to freely, use, modify and update these guidance materials and tools developed as part of the SOSCHI project.